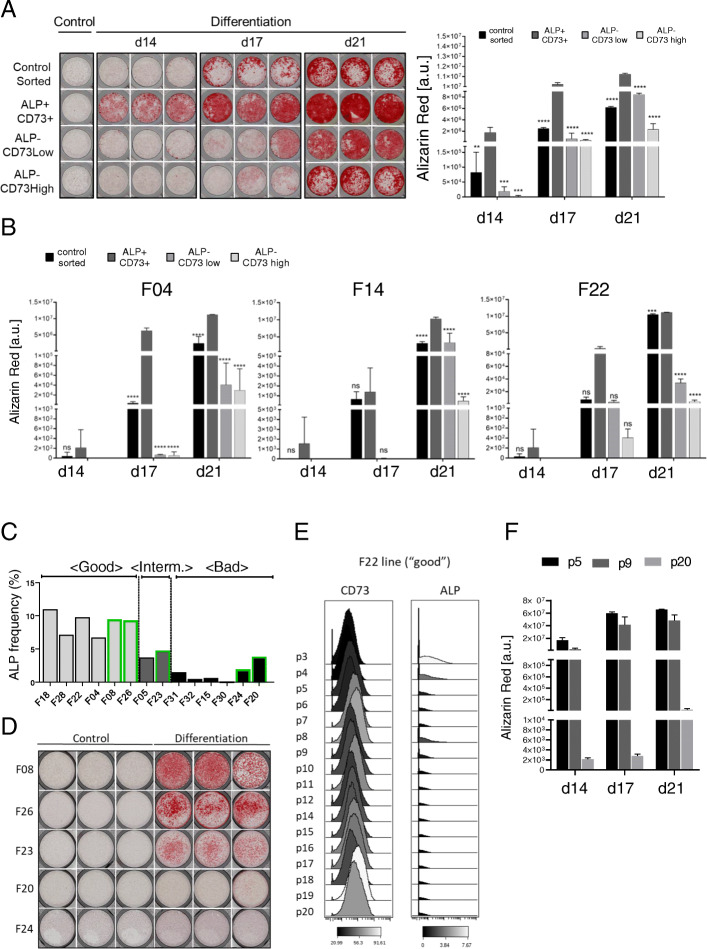
Fig. 4.
ALP+/CD73+ markers possess higher and predictive osteogenic potential. a Alizarin Red staining and quantification of F28 AD-MSC line sorted subpopulations (ALP+/CD73+, ALP−/CD73low, ALP−/CD73high) after 14, 17, and 21 days of osteogenic differentiation. Controls sorted are unstained cells, which were run through the FACS machine. Depicted is one triplicate of undifferentiated cells (control) and triplicates of cells cultured under osteogenic differentiation conditions (differentiation). b Quantification of Alizarin Red staining for F04, F14, and F22 AD-MSC lines for the same sorted subpopulations after 14, 17, and 21 days of osteogenic differentiation. Error bars indicate the triplicates of the staining and are presented as mean ± s.d. c Predicted categorization based on alkaline phosphatase (ALP) frequency in five new AD-MSC lines (green) and nine already characterized AD-MSC lines (reference) measured by CyTOF. d Alizarin Red staining at day 21 of the five new AD-MSC lines. Depicted are triplicates of undifferentiated cells (control) and cells cultured under osteogenic differentiation conditions (differentiation). e Histogram for the median intensity of expression of CD73 and ALP of F22 “good” AD-MSC line from passage 3 (p3) till passage 20 (p20). Black is the lowest intensity, and white represents the highest intensity. f Alizarin Red staining and quantification of F22 at passage p5, p9, and p20 after 14, 17, and 21 days of osteogenic differentiation. Error bars indicate the triplicates of the staining and are presented as mean ± s.d. For statistical analyses, the one-way ANOVA Dunnett’s multiple comparisons test was used to compare the ALP+/CD73+ population with the other sorted fractions within the same day: *p ≤ 0.05, **p ≤ 0.01, ***p ≤ 0.001, and ****p ≤ 0.0001. ns, not significant

