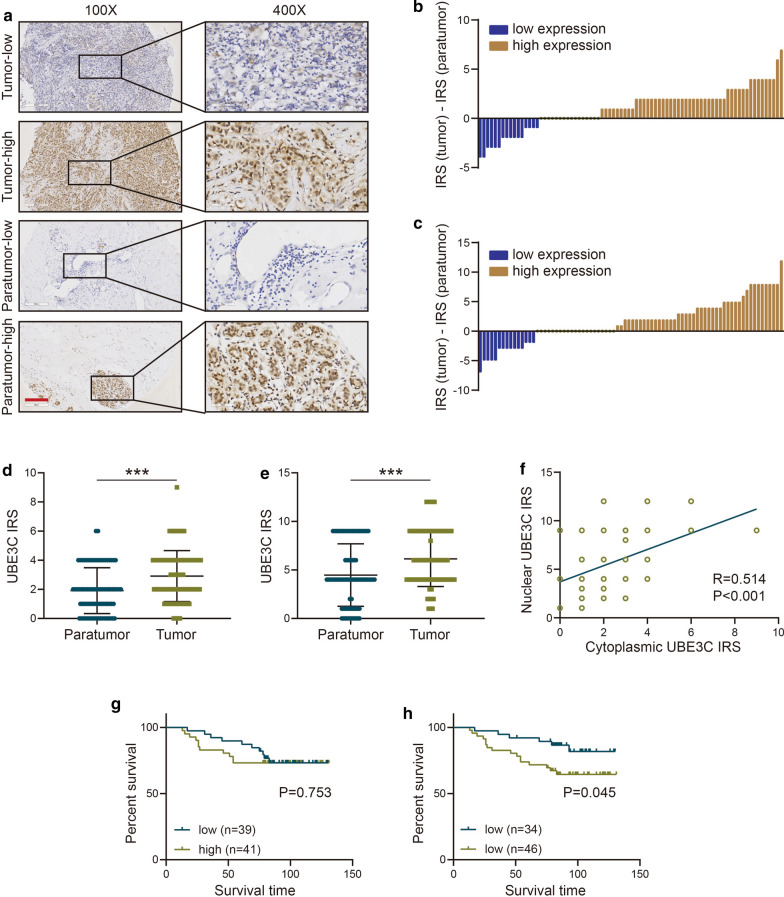
Fig. 1.
UBE3C expression in BrCa tissues. a Representative images showing BrCa and paired breast tissue samples stained for UBE3C. b, c The differences in cytoplasmic and nuclear UBE3C between BrCa tissues and normal tissues. d, e The relative expression levels of cytoplasmic and nuclear UBE3C in BrCa tissues compared with normal tissues. f Correlation between cytoplasmic and nuclear UBE3C. g Kaplan–Meier survival analysis of the OS of patients with BrCa stratified according to their cytoplasmic UBE3C expression level. h Kaplan–Meier survival analysis of the OS of patients with BrCa stratified according to their nuclear UBE3C expression level. ***P < 0.001. Bar = 200 μm

