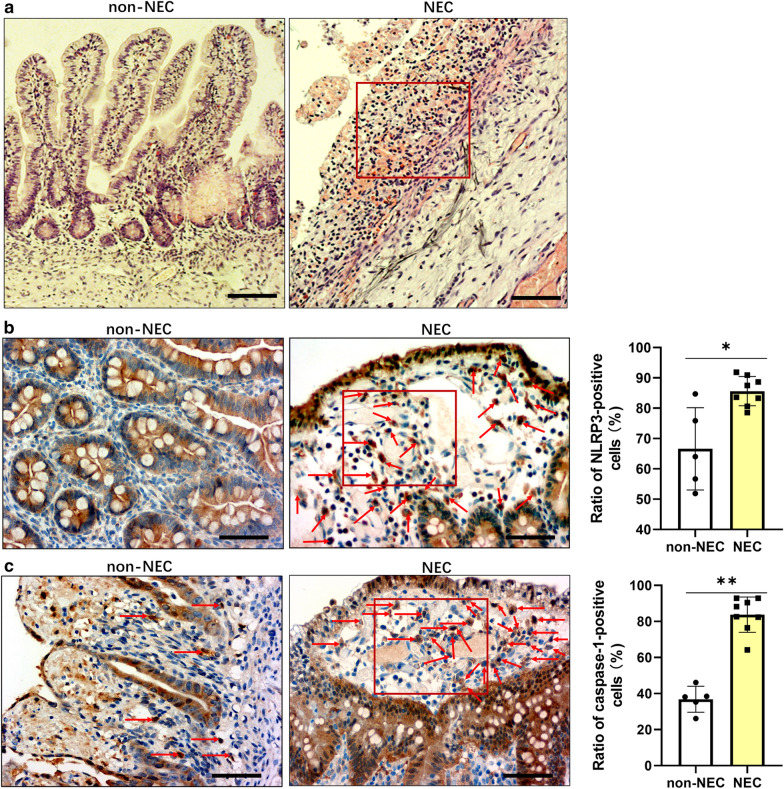
Fig. 1.
Morphology and expression profile of NLRP3 and caspase-1 in damaged ileum segments from NEC infants. Representative a HE staining (100×), immunohistochemistry staining (400×) and quantification of b NLRP3 and c caspase-1-positive cells in ileum biopsies from NEC and non-NEC infants (aged from 1 to 28 days). Red boxes in the immunohistochemistry images indicates necrotic areas in NEC; red arrows indicate NLRP3-positive and caspasa-1-positive cells in the lamina propria. Scale bars represent 200 µm for 100× or 50 µm for 400 × magnification. Each scatter in the quantification diagram represents the mean value of proportions of positively stained cells from 5 random reading areas in each section at 400× magnification. The lines indicate the mean with SD (non-NEC group, n = 5; NEC group, n = 8). *p < 0.05, **p < 0.01, Kruskal–Wallis test

