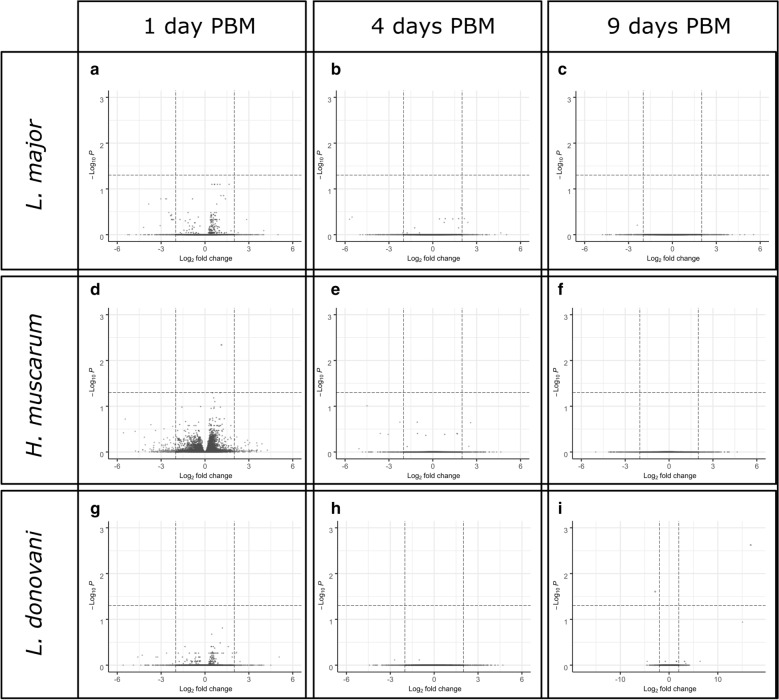
Fig. 3.
Volcano plots of statistical significance against log2-fold changes in transcript abundance. Blood-fed Phlebotomus papatasi sand flies were compared to P. papatasi fed L. major ( a–c), H. muscarum (d–f) and L. donovani (g–i). Dashed lines indicate the log2 fold change = − 2/2 and P = 0.05 thresholds. Transcripts in red dots exceed the statistical significance threshold. Green dots indicate transcripts which exceeded the fold-change thresholds but were not statistically significantly different between the two feeding conditions. Gray dots indicate transcripts which meet neither of the statistical or fold-change thresholds. Analysis was performed in DESeq2 package for R and visualized using the EnhancedVolcano function

