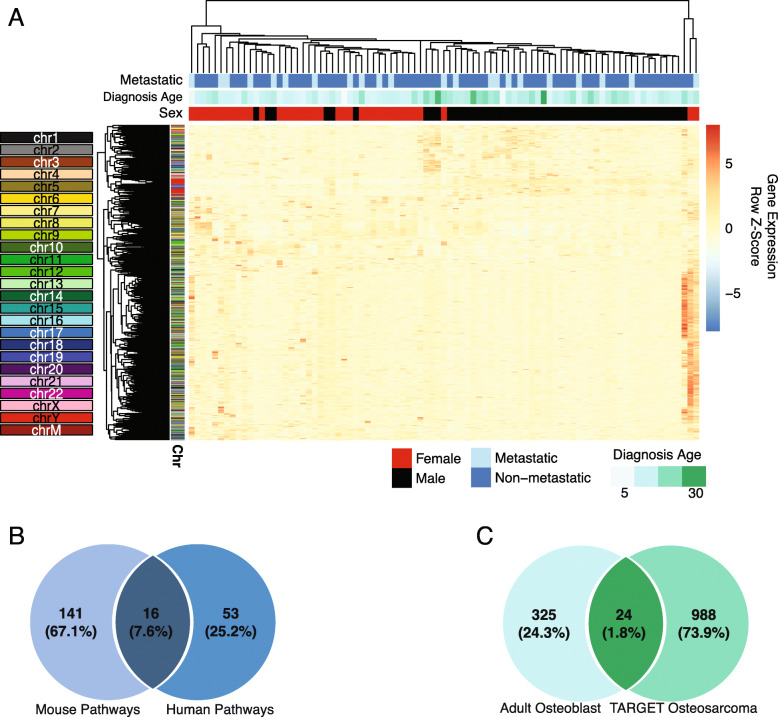
Fig. 2.
Sex differences in TARGET-OS gene expression. a Heatmap of all differentially expressed genes (adj. p value < 0.05) identified between male and female TARGET-OS samples. Top color bars indicate the sex (male = black, red = female), if metastasis was detected at diagnosis (light blue = metastatic, dark blue = non-metastatic), and age at diagnosis in years (darker green = older patients). Sample and gene order of the heatmap was dictated by unsupervised hierarchal clustering using Euclidean distance and complete clustering. Side color bars indicate the chromosomal location of the gene. b Overlap between enriched pathways in differentially expressed genes between male and female mouse-OS and TARGET-OS. c Overlap between differentially expressed genes between healthy male and female osteoblasts and TARGET-OS

