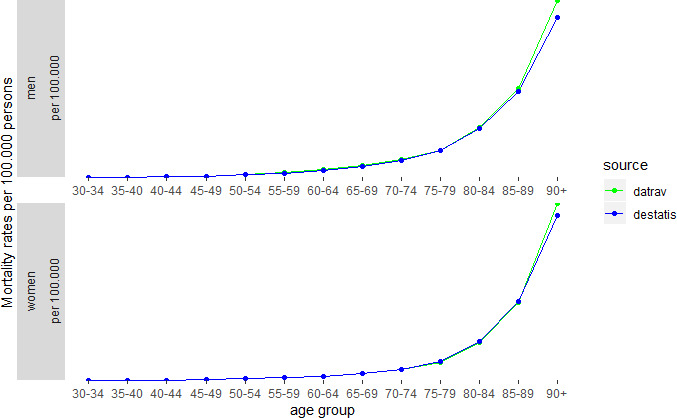
Figure 2.

Age-specific mortality rates per 100 000 persons stratified by sex for the year 2014 as obtained from official cause of death statistics (Destatis) and claims data (Datrav). The blue line indicates results from official statistics; the green line indicates results from the DaTraV dataset. DaTraV, Data Transparency Regulation Act.
