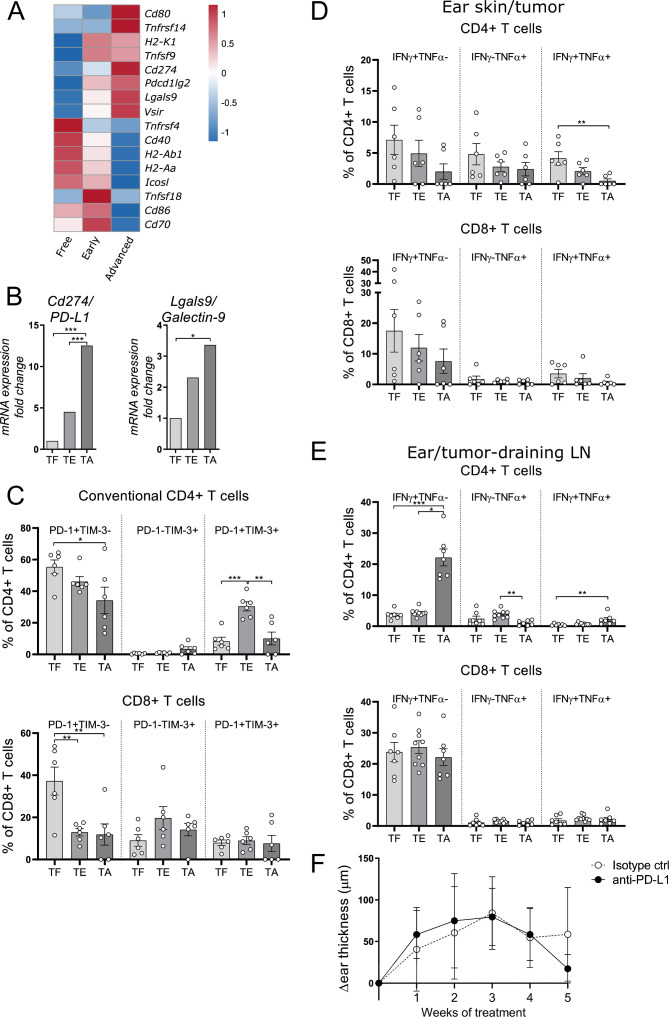
Figure 1.
Immunosuppressive molecules increase with tumor progression. (A) RNA-seq analysis was performed with ear skin/tumor tissue from TF (tumor-free), tumor-early (TE) and TA (tumor-advanced) tg(Grm1)EPv mice. The heatmap depicts normalized and relative expression (z-score) levels of several checkpoint ligands. Mean expression for three mice per group is shown. (B) The mRNA levels of programmed death ligand-1 (PD-L1) and Galectin-9 from ear skin/tumors of TF, TE, TA mice were quantified by real-time quantitative PCR. Fold change in comparison to the TF stage is shown for five to six mice per group from one to two independent experiments. (C) Percentages of PD-1+ and TIM-3+ conventional CD4+ and CD8+ T cells from ear skin/tumors of TF, TE, TA tg(Grm1)EPv mice were determined by flow cytometry. Summary graph for seven mice per group from four independent experiments is shown. (D, E) Cell suspensions from ear skin/tumors (D) and draining lymph nodes (LNs) (E) were restimulated in vitro with anti-CD3/anti-CD28 mAbs. The percentages of interferon γ (IFNγ) and tumor necrosis factor α (TNFα) producing CD4+ and CD8+ T cells were analyzed by flow cytometry. Results are from three independent experiments with six to eight mice per group. (F) Tg(Grm1)EPv mice at the transition from TE to TA stage (6.5–7 months old) were treated intraperitoneally with anti-PD-L1 mAb twice per week. Tumor growth was determined by measuring ear thickness changes over time. Results for six mice per group from two independent experiments are shown. Statistical significance was determined using one-way analysis of variance or Kruskal-Wallis analysis (B–E) and two-tailed unpaired Student’s t-test (F). Graphs show the mean ± SE. *p<0.05; **p<0.01; ***p<0.001.

