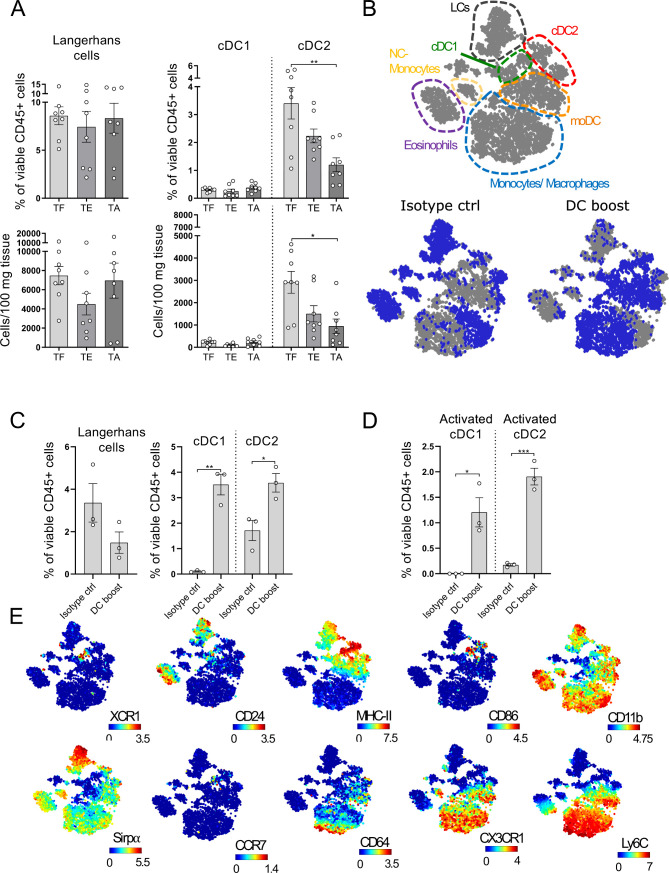
Figure 2.
Dendritic cells (DCs) gradually decrease in melanoma lesions and can be restored by a DC boost approach. (A) Ear skin/tumors of TF (tumor-free), tumor-early (TE) and tumor-advanced (TA) tg(Grm1)EPv mice were analyzed by flow cytometry for the percentages of skin DC subsets (gating strategy shown in online supplemental figure S2A). Results from six to eight to 8 mice per group from five independent experiments are shown. (B) tg(Grm1)EPv mice at the transition from TE to TA stage (6.5–7 months old) were treated as illustrated in online supplemental figure S2C. Changes in the myeloid cells were determined by mass cytometry. Top panel: the different populations shown in the viSNE map were identified by manual gating (online supplemental figure S2D). Bottom panels: In blue, the distribution of the identified cells for isotype control (left) and DC boost (right) treated mice are shown. (C) The frequencies of the different skin DC subsets in isotype and DC boost treated mice were determined. (D) The frequencies of activated cDC1 and cDC2 as determined by CD86 expression are shown. (E) Surface expression of XCR1, CD24, MHC-II, CD86, CD11b, Sirpα, CCR7, CD64, CX3CR1 and Ly6C by the various myeloid subsets are shown on the viSNE plots. For (B)–(E) results for three mice from two independent measurements are shown. Statistical significance was determined using one-way analysis of variance or Kruskal-Wallis analysis (A) and two-tailed unpaired Student’s t-test (C and D). Graphs show the mean ± SE. *p<0.05; **p<0.01; ***p<0.001.

