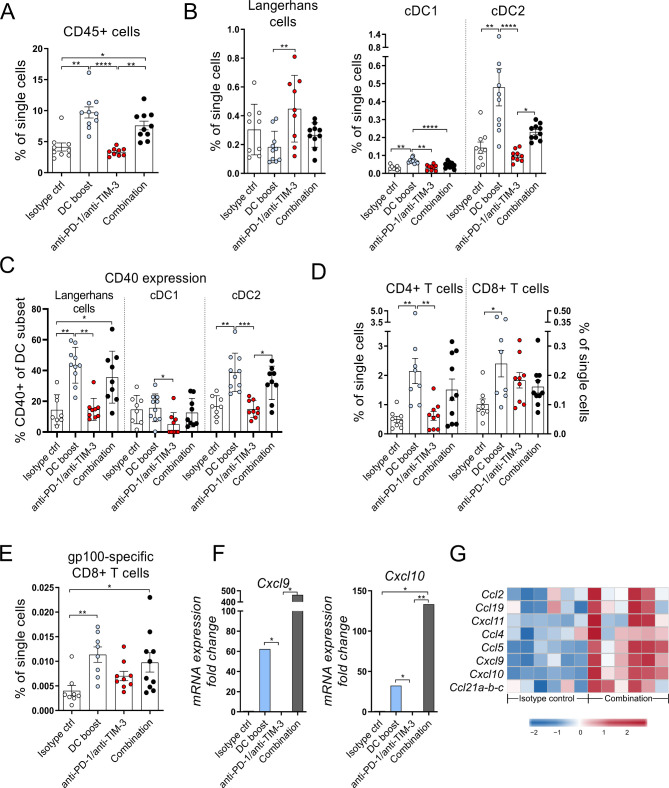
Figure 4.
The DC boost results in increased infiltration of activated dendritic cells (DCs) and T cells into tumors. Tg(Grm1)EPv mice at the transition from tumor-early (TE) to tumor-advanced (TA) stage were treated for 5 weeks as described in figure 3A. (A–E) Frequencies of the CD45+ immune cells (A), skin DC subsets (B), CD40 expression on DC subsets (C), CD4+ and CD8+ tumor-infiltrating T cells (D) and gp100-specific CD8+ T cells (E) were determined by flow cytometry. For (A)–(E), n=8–10 mice per group from two independent experiments. (F) The mRNA levels for Cxcl9 and Cxcl10 were quantified by real-time quantitative PCR. Fold change in comparison to the isotype control is shown for n=4–6 mice per group from three independent experiments. (G) Tumor RNA from isotype control and combination therapy treated mice was analyzed by microarray. Heatmap from microarray data displaying the normalized and relative expression (z-score) of genes associated with lymphocyte trafficking. n=6 mice per group from two independent experiments. For (A)–(F), statistical significance was determined using one-way analysis of variance or Kruskal-Wallis analysis. Graphs show the mean ± SE. *p<0.05; **p<0.01; ***p<0.001; ****p<0.0001. PD-1, programmed cell death protein-1; TIM-3, T-cell immunoglobulin and mucin-domain containing-3.

