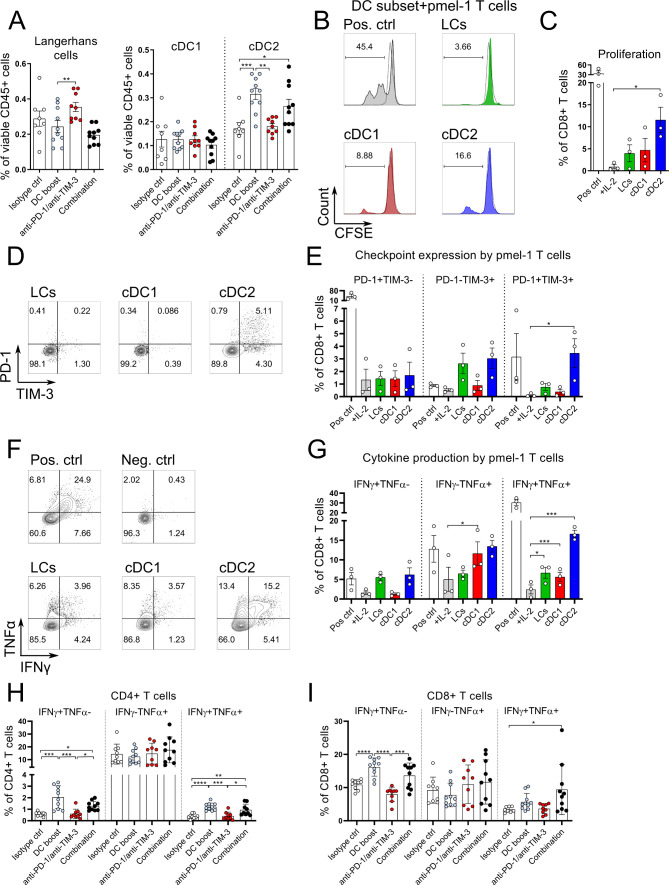
Figure 5.
DC boost treatment improves antitumor immune responses in the draining lymph node. (A) Tg(Grm1)EPv mice at the transition from tumor-early (TE) to tumor-advanced (TA) stage were treated for 5 weeks as described in figure 3A. Percentages of migratory skin dendritic cell (DC) subsets were determined by flow cytometry in the tumor draining lymph nodes (LNs). (B–G) Tg(Grm1)EPv/Langerin-EGFP mice at the transition from TE to TA stage were treated with the DC boost regimen as in online supplemental figure S2C. The three main migratory skin DC subsets (LCs, cDC1, cDC2) were sorted from the tumor-draining LNs (see online supplemental figure S4C for sorting strategy). Sorted DCs were cocultured with gp100-specific CD8+ T cells isolated from pmel-1 mice in a ratio of DCs:T cells 1:3 for 3 days. As a negative control, T cells were cultured without stimulation but with IL-2 only (+IL-2). T cells cocultured with gp100 peptide loaded DCs served as positive control (Pos ctrl). (B) Representative histograms showing carboxyfluorescein succinimidyl ester (CFSE) dilution of CD8+ T cells in response to the different DC subsets. (C) Percentages of proliferated CD8+ T cells from three independent experiments. (D) Representative dot plots showing the expression of PD-1 and TIM-3 on the CD8+ T cells after 3 days of coculture with the different DC subsets. (E) Percentages of PD-1+ and TIM-3+ CD8+ T cells from three experiments. (F) At day 3 of coculture, CD8+ T cells were restimulated with anti-CD3/anti-CD28 mAbs and production of IFNγ and TNFα was measured by intracellular flow cytometry. Representative dot plots showing cytokine production by T cells in response to the different DC subsets. (G) Percentages of IFNγ+ and of TNFα+ CD8+ T cells from three experiments are shown. (H and I) LN cell suspensions of Tg(Grm1)EPv mice at the transition from TE to TA stage that were treated for 5 weeks as described in figure 3A were restimulated in vitro with anti-CD3/anti-CD28 mAbs. Percentages of IFNγ+ and TNFα+ CD4+ T cells (H) and CD8+ T cells (I) were analyzed by flow cytometry. Statistical significance was determined using one-way analysis of variance (ANOVA) or Kruskal-Wallis analysis (A, H, I), Friedman test (C and E) and repeated-measures one-way ANOVA (G). Graphs show the mean ± SE. *p<0.05; **p<0.01; ***p<0.001; ****p<0.0001. IFNγ, interferon γ; PD-1, programmed cell death protein-1; TIM-3, T-cell immunoglobulin and mucin-domain containing-3; TNFα, tumor necrosis factor α.

