Figure 3.
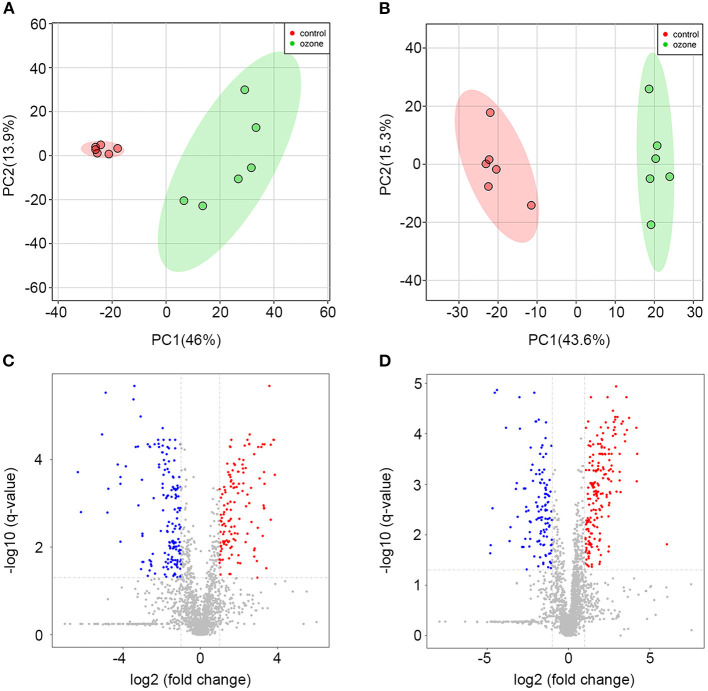
Metabolomics profiling analyses for 40 μg/ml ozone group vs. control group. (A) Score plots of the principal component (PC) distinguishing 40 μg/ml ozone group (n = 6) from control group (n = 6) based on their metabolomics pattern with PC-1 (46.0%) and PC-2 (13.9%) in ESI+ mode. (B) Score plots of the PC distinguishing 40 μg/ml ozone group from control group based on their metabolomics pattern with PC-1 (43.6%) and PC-2 (15.3%) in ESI- mode. (C,D) Volcano plot demonstrates metabolite changes in ESI (±) mode. Fold change (FC) on the x-axis and FDR-adjusted P-values on the y-axis. Black vertical and horizontal lines show the filtering criteria (FC = 1.0 and FDR corrected P-value < 0.05).

