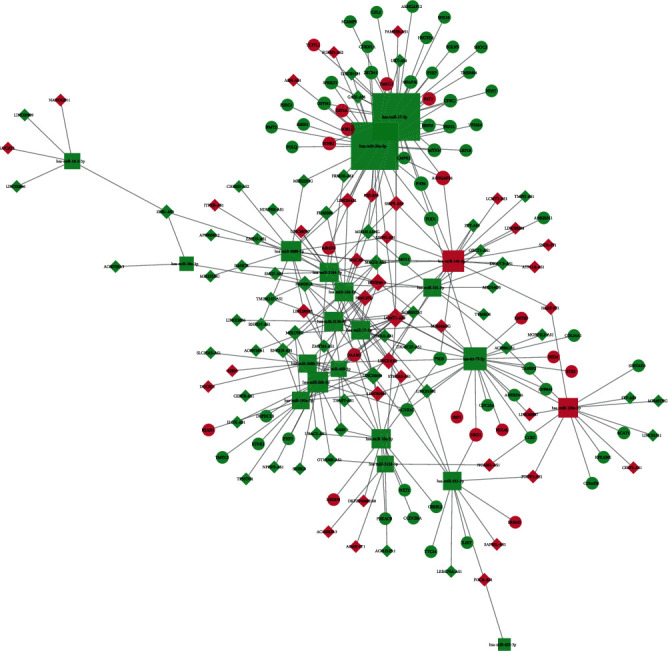
Figure 2.

Visualization of the lncRNA-miRNA-mRNA network, which is composed of 91 lncRNA nodes, 70 mRNA nodes, 21 miRNA nodes, and 288 edges. The diamond nodes represent the lncRNAs, the circular nodes represent the mRNAs, and the square nodes represent the miRNAs. Red represents upregulated expression, whereas green represents downregulated expression. The size of the node represents the degree of the node.
