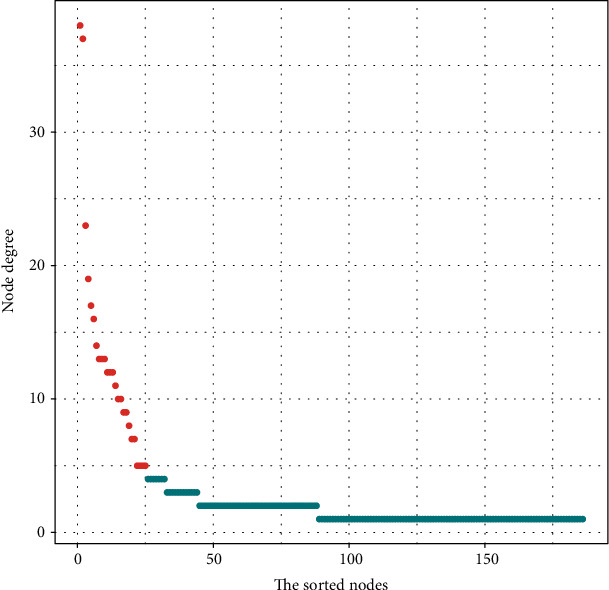
Figure 5.

Node degree analysis of the nodes reveals specific properties of the lncRNA-miRNA-mRNA network. The abscissa axis represents the nodes sorted according to the node degree, the left side of the abscissa axis represents nodes with a high degree of nodes, and the right side of the abscissa axis represents nodes with a low degree of nodes. The ordinate axis represents the node degree of the node. The red dots represent the central node, and the blue dots represent the noncentral nodes.
