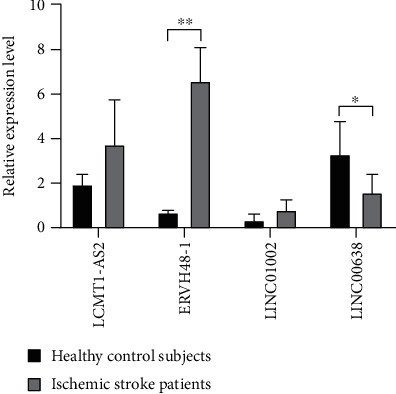
Figure 6.

Comparison of the relative expression of lncRNAs between ischemic stroke patients and healthy control subjects. ∗p < 0.05 and ∗∗p < 0.01.

Comparison of the relative expression of lncRNAs between ischemic stroke patients and healthy control subjects. ∗p < 0.05 and ∗∗p < 0.01.