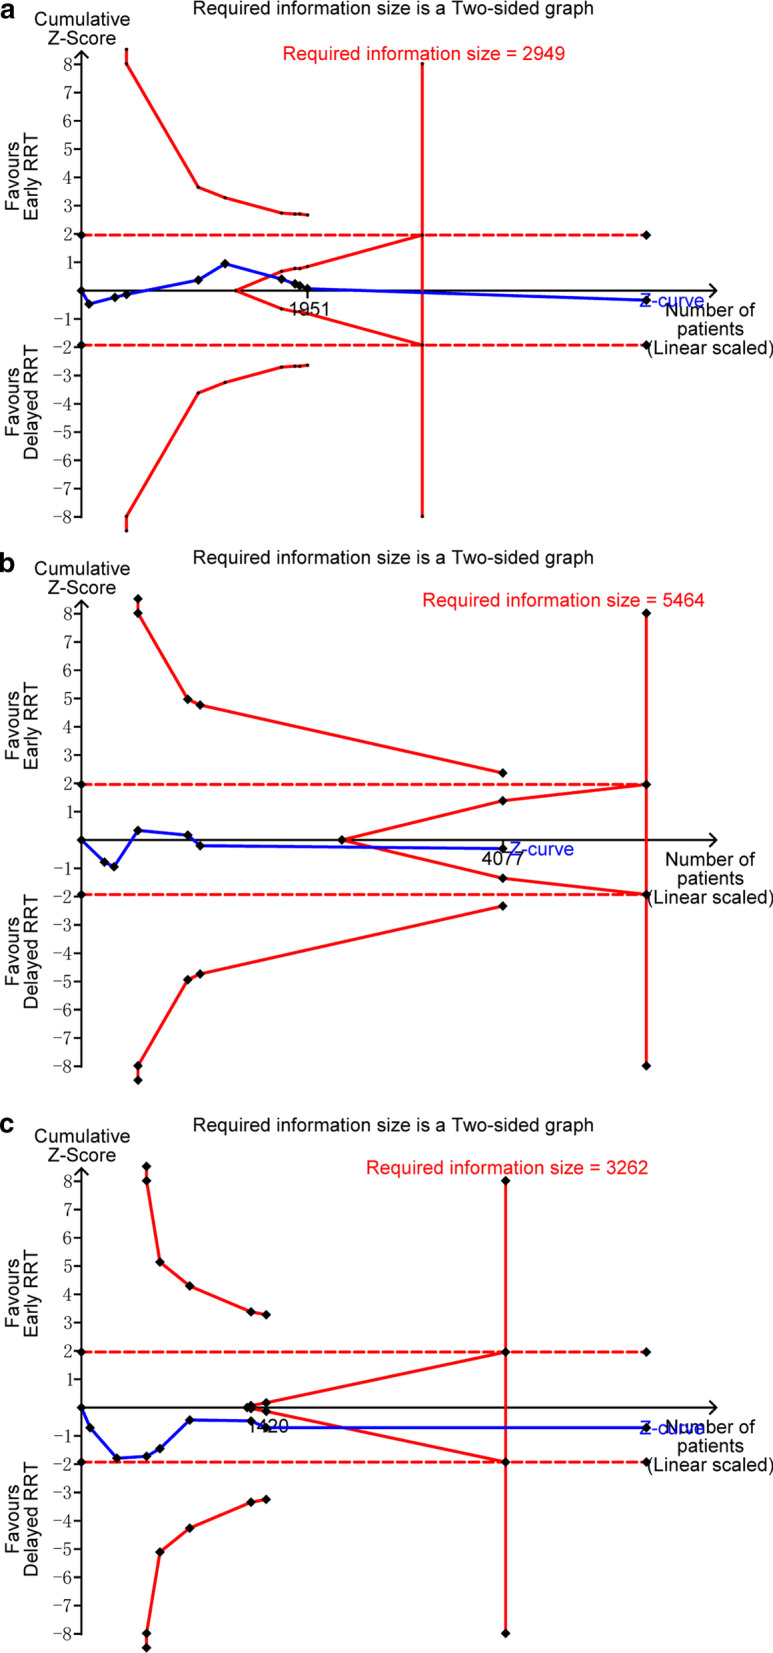
Fig. 3.

Trial sequential analysis. a–c The cumulative Z curve (complete blue line) was constructed using a random effects model. Etched red line shows conventional test boundary. Complete red line represents the trial sequential monitoring boundary. a. TSA for 28-day mortality. A diversity-adjusted information size of 2949 patients was calculated on the basis of using α = 0.05 (two sided), β = 0.10 (power 90%), an anticipated relative risk reduction (RRR) of 15.0%, and a control event rate of 38.0%. The cumulative Z curve crossed the futility boundary and reached the required information size. b TSA for 90-day mortality. A diversity-adjusted information size of 5464 patients was calculated on the basis of using α = 0.05 (two sided), β = 0.10 (power 90%), an anticipated relative risk reduction (RRR) of 15.0%, and a control event rate of 45.9%. The cumulative Z curve crossed the futility boundary. c. TSA for hospital mortality. A diversity-adjusted information size of 3262 patients was calculated on the basis of using α = 0.05 (two sided), β = 0.10 (power 90%), an anticipated relative risk reduction (RRR) of 15.0%, and a control event rate of 39.3%. The cumulative Z curve crossed the futility boundary and reached the required information size
