Fig. 4.
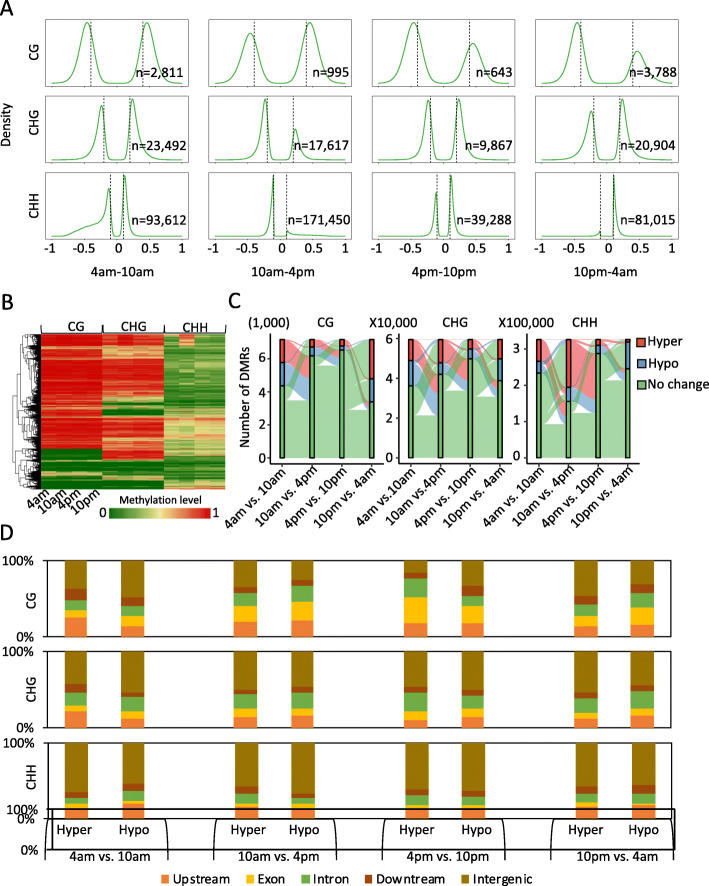
DNA methylation variance of green tip at different diel periods. a Density of differential methylation regions of CG, CHG, and CHH contexts across diel time course of green tip leaf tissue. ‘n’ denotes the number of DMRs. The vertical dotted lines mean the defined threshold of different DNA methylation changes (e.g. 0.4 for CG, 0.2 for CHG, and 0.1 for CHH methylation). b Heat map of DNA methylation levels of all DMRs (CG+CHG+CHH) of green tip leaf tissue. c Sankey plot of DMR dynamics across different periods of green tip of CG, CHG, and CHH contexts. d The genomic distribution of DMRs of green tip across different diel time course

