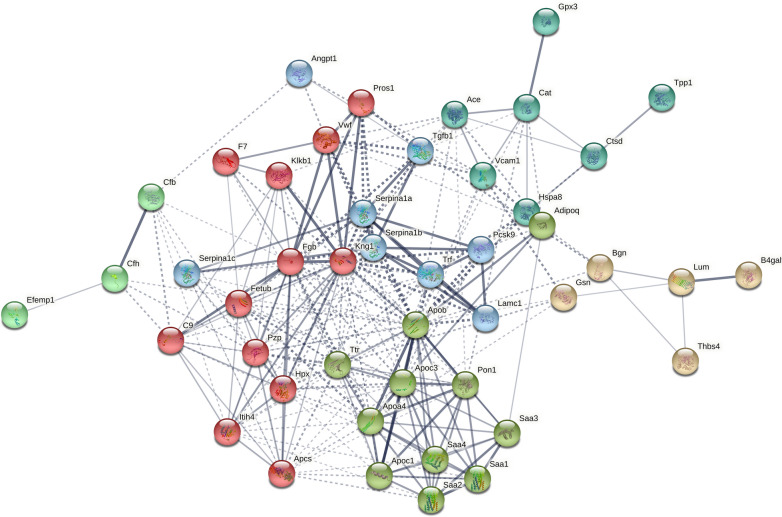
Fig. 2.
The protein–protein interactions for the differentially expressed proteins in ApoE−/−/LDLR−/− mice (vs. WT) that were analysed using STRING 11 software. In the network analysis the differentially expressed proteins were presented as nodes, whereas edges represent predicted protein–protein associations. Using the protein interaction network analysis tool (STRING database), seven networks of the associated proteins were found among the differentially expressed proteins that were depicted by relevant colours. These included proteins mainly involved in: (1) acute phase response and/or being a constituent of lipoprotein particles (olive), (2) coagulation cascade (red), (3) alternative complement pathway (mint), (4) existing as inhibitors of serine proteases (light blue), (5) participating in adhesion of leukocytes to endothelial cells/renin-angiotensin system over-activation or modulation of oxidative stress (turquoise), (6) modulation of extracellular interactions/extracellular matrix re-organization (salmon), and (7) others – the disconnected node in the network represented by creatine kinase (hidden in the plot)

