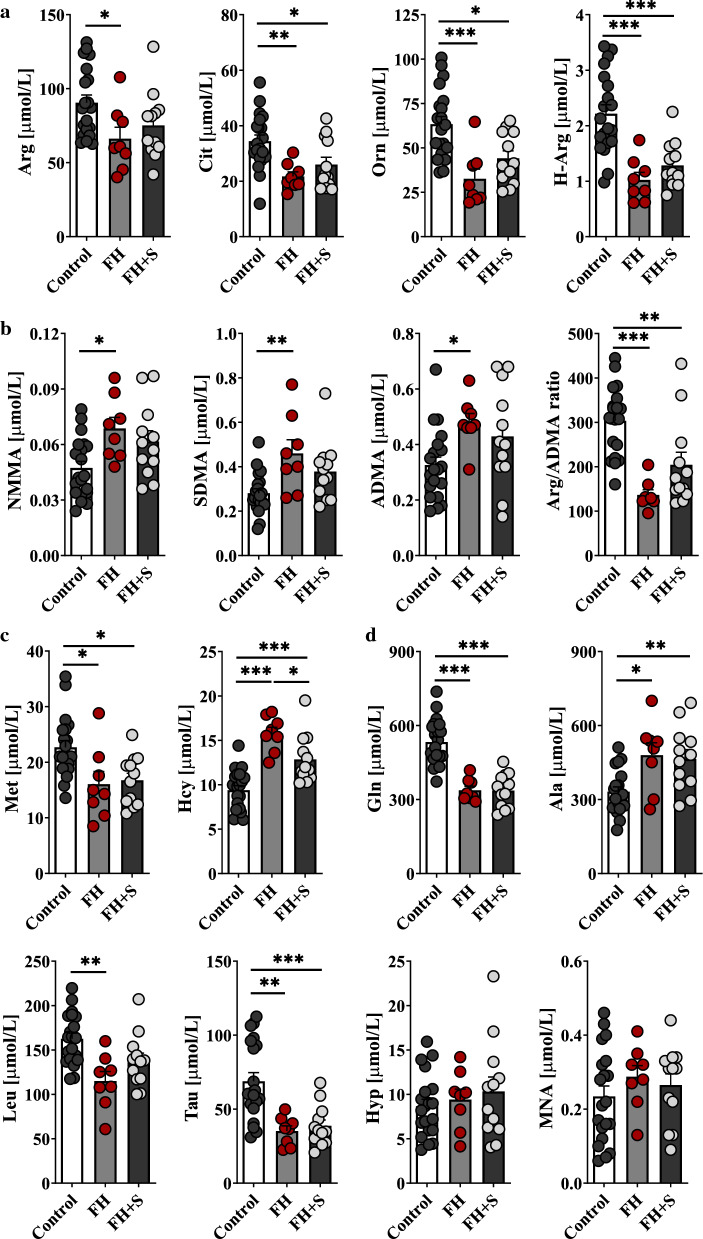
Fig. 7.
A snapshot of serum metabolites in the setting of familial hypercholesterolemia (discovery cohort). Human metabolomic signatures related to atherogenic dyslipidaemia closely reflect the pattern already identified in ApoE−/−/LDLR−/− mice. The top (a) row depicts serum concentration of substrates for NOSs (L-Arg, H-Arg) and Arg precursors (L-Cit, L-Orn), the middle rows -methylated Arg derivatives (NMMA, SDMA, ADMA) and L-Arg/ADMA ratio (b), and L-Met, Hcy (c), respectively and d refers to other altered metabolites determined in FH cases (n = 20) vs. healthy subjects (n = 20). Data represent mean ± SEM. *P < 0.05, **P < 0.01, ***P < 0.001. FH + S – FH patients on statins

