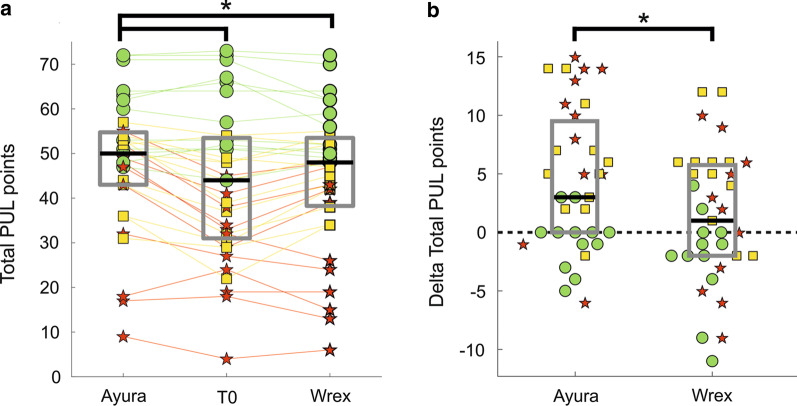
Fig. 5.
PUL module results. a Reports raw total PUL values (on a scale 0–74 points) at T0, T1 with the semi-active device, and T1 with the passive one. Green circles, yellow squares, and red stars represent PUL scores of slightly impaired, moderately impaired, and severely impaired subjects respectively. Straight lines connect data from the same participant. Grey boxes identify interquartile ranges and the black lines highlight the median values. Asterisks indicate statistical differences () between groups, tested with Friedman’s and post hoc comparisons. b Reports Delta PUL values (i.e., the difference between T1, with the semi-active or passive device, and T0 PUL scores. Each data point is represented with the same marker and color code of a. The dashed black line indicates the zero delta value. Asterisk indicates a statistical difference between the two groups, as computed by means of Friedman’s test (p = 0.001015)

