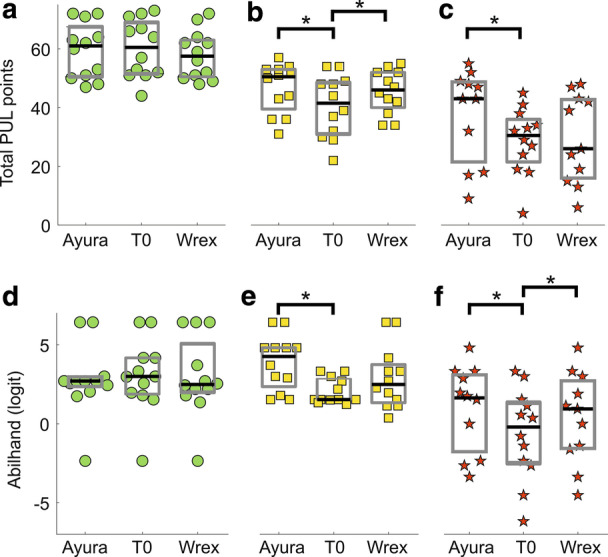
Fig. 6.

Upper panels: PUL module results for the sub-groups analysis. a slightly impaired subjects; b moderately impaired subjects; c severely impaired subjects. Lower panels: Abilhand scores, expressed in logit, for the sub-groups analysis. One logit is the distance along the line of the variable that increases the odds of observing the event specified in the measurement model by a factor equal to Euler’s constant e. All logits are the same length with respect to this change in the odds of observing the indicative event. Higher scores represent higher perceived manual ability. d Slightly impaired subjects; e moderately impaired subjects; f severely impaired subjects. Green circles, yellow squares, and red stars represent PUL scores of slightly impaired, moderately impaired, and severely impaired subjects respectively. Straight lines connect data from the same participant. Grey boxes identify interquartile ranges and the black lines highlight the median values. Asterisks indicate statistical differences () between groups, tested with Friedman’s and post-hoc comparisons
