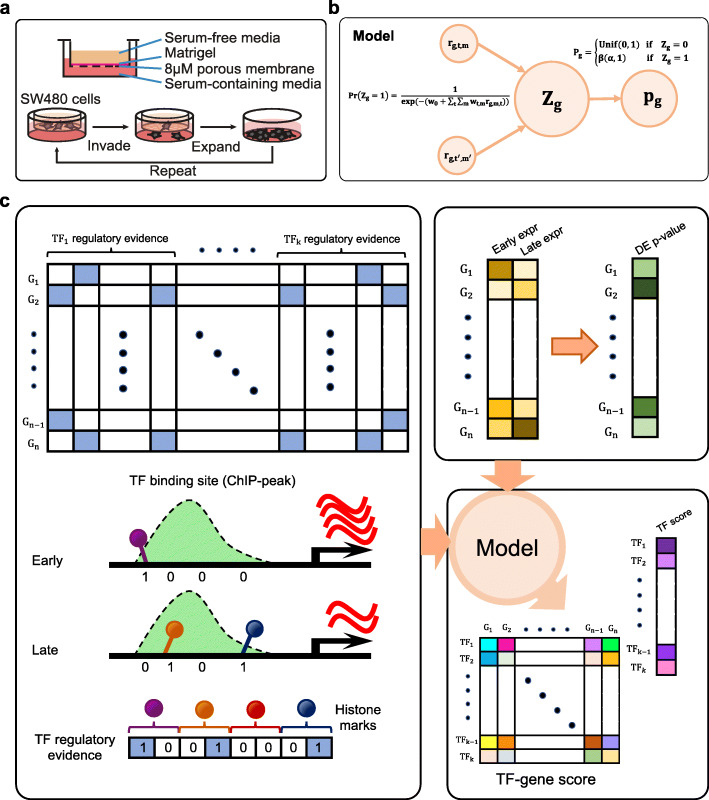
Fig. 1.
Schematics of study design and analysis framework. a An invasive sub-culture of SW480 cells was established by repeated selection of cells that could invade through porous membrane coated with synthetic extra-cellular matrix toward a chemoattractant (serum). b The pGENMi probabilistic model was adapted to aggregate cis-regulatory evidence associated with each differentially expressed (DE) gene. Pg represents the differential expression p-value of gene g, Zg is a binary hidden variable that represents if g mediates the regulatory influence of one or more known TFs on CRC invasiveness, and rg, t, m represents a (binary) cis-regulatory evidence in the form of a binding site for TF t, flagged by dynamic histone mark m, in the regulatory region of gene g. The weighted sum of cis-regulatory evidence (with learnable weights wt, m) determines Pr(Zg = 1). Pg follows a beta distribution if Zg = 1 and is uniform if Zg = 0. c Overview of the analysis. Left panel depicts the matrix of cis-regulatory evidence for multiple TFs and all genes. A TFBS overlapping with a change of histone mark between stages is encoded with two bits, one for either direction of change. Each TF is thus represented by eight bits, representing four histone marks. The evidence matrix and the DE p-values of genes (between the early and late stages) are inputs to the model. The output of the model contains a score assigned to each TF representing its contribution to the model and a score associated with each (TF, gene) pair representing the extent to which the gene mediates the effect of the TF on CRC invasiveness

