Fig. 2.
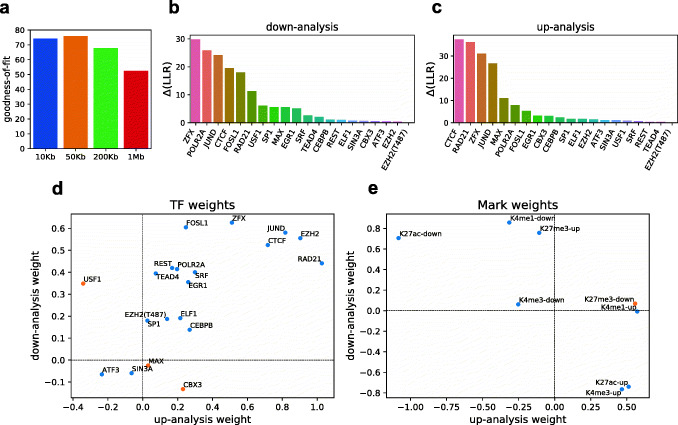
Regulatory influences learnt by model. a Comparison of goodness-of-fit for each distance threshold (maximum distance upstream or downstream of gene) used for associating TF ChIP-peaks with genes. The goodness-of-fit is measured by the sum of test LLRs (derived from cross-validation on the entire dataset) from up- and down-analyses, averaged over 100 repeats of the procedure. The distance and regularization coefficient used by the best-fit model were then used to re-train the model on the entire dataset. b, c Model-based ranking of TFs, in down- and up-analysis, respectively. Each TF’s contribution was measured by zeroing its regulatory evidence and calculating the change in model LLR (∆(LLR)). d TF weights learned by the fw-pGENMi for down-analysis and up-analysis. All of the TFs except three, USF1, MAX, and CBX3, were assigned a consistent role in both analyses. A positive weight suggests an activating role for a TF while a negative weight represents a repressive role. e Weights for histone mark changes learned by fw-pGENMi for down- and up-analysis. A positive weight for a “mark-up” (respectively, “mark-down”) change for up-analysis (respectively, down-analysis) suggests an activating histone mark. This is the case for H3K27ac, H3K4me1, and H3K4me3. The mark H3K27me3 has the opposite pattern, consistent with a repressive role

