Fig. 5.
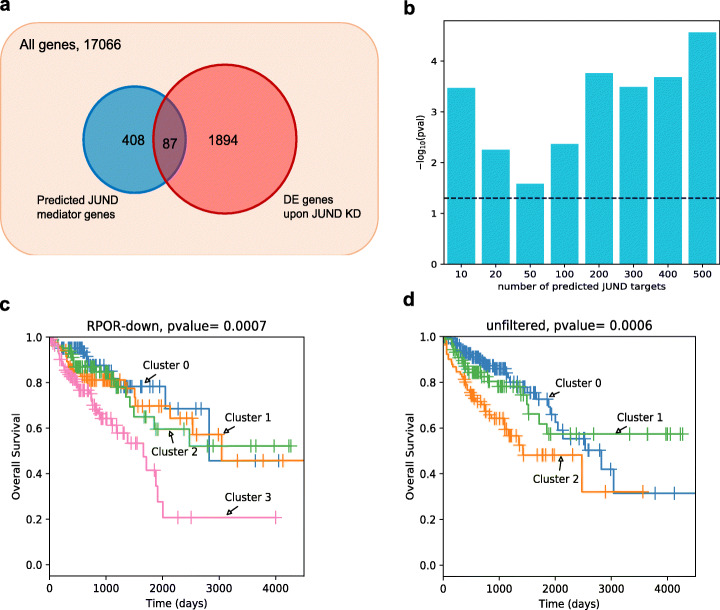
TF regulons provide a gene signature of prognostic value. a Venn diagram showing the top ~ 500 predicted target genes with the highest RPOR in the down-analysis and 1981 JUND-KD-DE genes with p-value < 0.05. Their intersection (87 genes) has a hypergeometric test p-value of 3E−5. b Significance (-log10 of hypergeometric test p-values) of the overlap between the JUND-KD-DE gene set and predicted target gene sets of varying sizes. The target genes were predicted based on their RPOR value in the down-analysis. The dashed horizontal line represents a p-value of 0.05. c, d The Kaplan-Meier survival analysis performed on the overall survival of 374 COAD patients from TCGA. In c, patients are clustered into four groups using expression profiles of the top 70 genes with the highest RPOR in our down-analysis, as well as somatic mutations associated with these genes and the expression of miRNAs targeting them. In d, patients are clustered into three groups using the expression profiles of all genes, as well as with somatic mutations associated with them and the expression profiles of miRNAs targeting the genes

