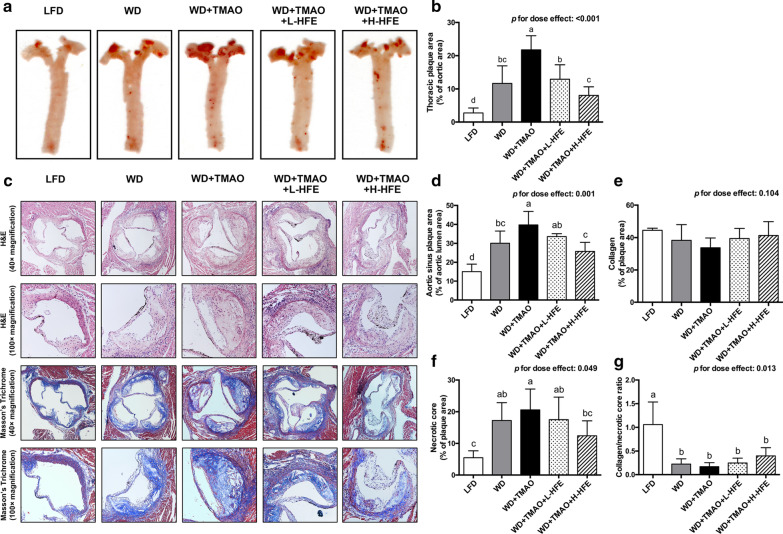
Fig. 3.
Atherosclerotic lesions in ApoE−/− mice. a Representative images and b quantification of en face oil-red-O stained plaque area in the thoracic aorta. c Representative images of cross-sections at the aortic sinus stained with H&E and Masson’s Trichrome. Images were taken at 40 × and 100 × magnification. Quantification of d plaque area, e collagen content, f necrotic core area, and g the ratio of collagen to necrotic core in the aortic sinus of ApoE−/− mice. Data are expressed as mean with SD, n = 8. a,b,c,dmeans with different superscript letters differ significantly at p < 0.05 by one-way ANOVA. p for dose effect was analyzed using ordinary linear regression across WD + TMAO, WD + TMAO + L-HFE, and WD + TMAO + H-HFE groups

