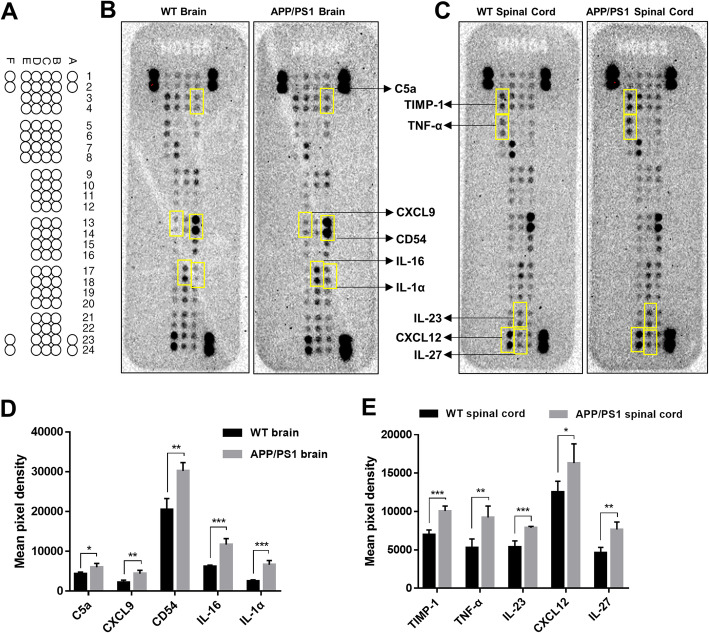
Fig. 4.
Comparisons of cytokine expression in the brain and spinal cord of WT and APP/PS1 mice. a Cytokine array coordinates on membranes. b, c Representative membrane images of cytokine expression in the b brain and c spinal cord. Compared with WT mice, d 5 cytokines were significantly upregulated in the brain of APP/PS1 mice, and e 5 cytokines were significantly upregulated in the spinal cord of APP/PS1 mice. n = 4 in each group. Statistical analyses were conducted with multiple t tests with false discovery rate (FDR) correction. *P < 0.05, **P < 0.01. ***P < 0.001

