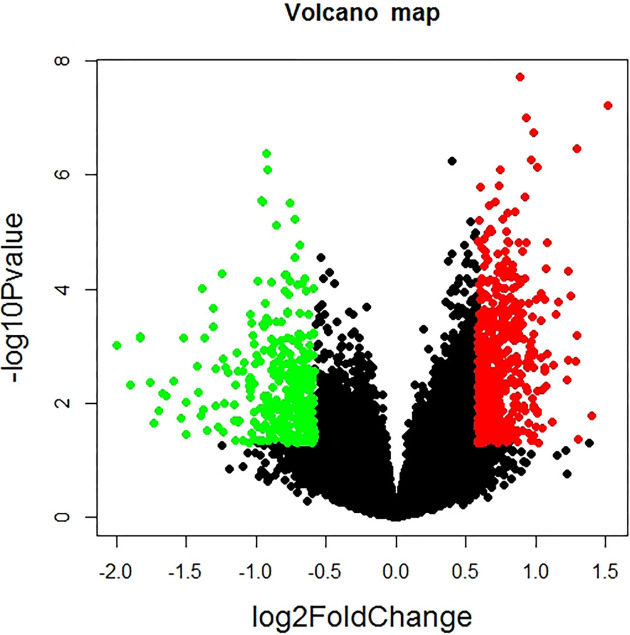
Figure 1. Volcano plot demonstrating the differential expression of all genes.
Red points mean up-regulated genes screened on the basis |log2 fold change| ≥ 0.585 and P-value <0.05. Green points mean down-regulated genes screened on the basis |log2 fold change| ≥ 0.585 and P-value <0.05. Black points represent genes with no difference in expression.

