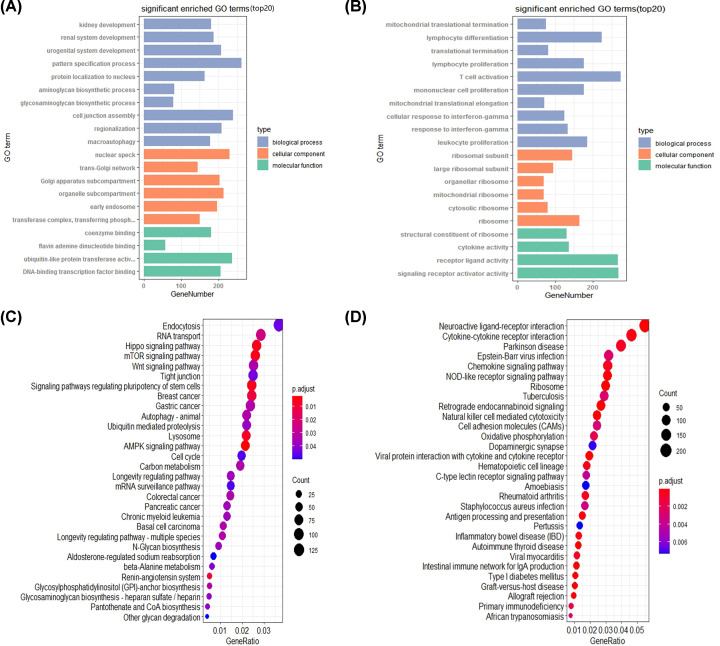
Figure 2. GO and KEGG enrichment analysis of the PPI network.
(A) Top 20 significantly enriched GO annotations of up-regulated DEGs, including three groups (molecular function, biological process and cellular component), P<0.05. (B) Top 20 significantly enriched GO annotations of down-regulated DEGs, P<0.05. (C) Top 20 functional pathways of up-regulated DEGs through KEGG analysis, P<0.05. (D) Top 20 functional pathways of down-regulated DEGs through KEGG analysis, P<0.05.

