Fig. 2.
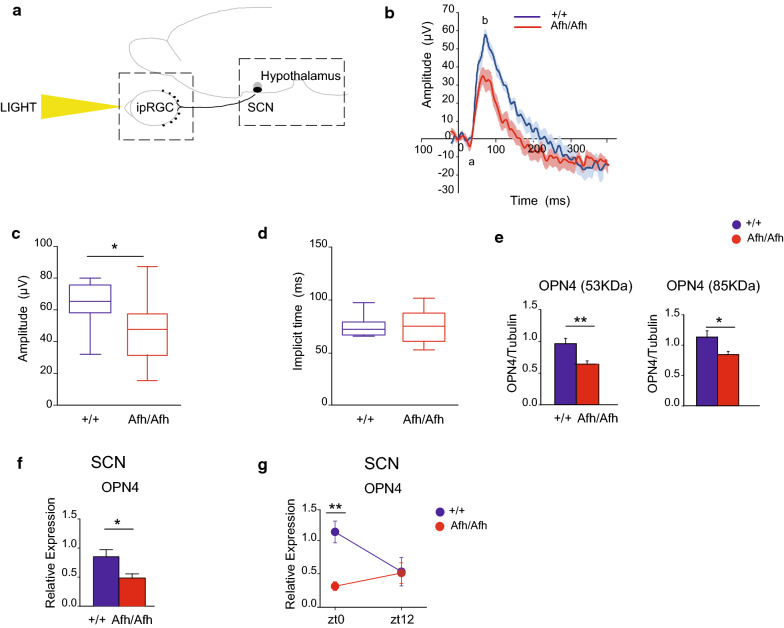
Altered cone response coupled with a decrease in OPN4 expression in the retina and the SCN of Afh/Afh mice. a Schematic representation of the RHT nodes, starting from the intrinsically photosensitive retinal ganglion cells (ipRGCs) to SCN and hypothalamus. b Flash electroretinogram (fERG) waveform of the cone response in Afh/Afh and +/+ animals (n = 14 for each genotype) measured in photopic conditions. The saturated negative response and the positive response are represented with letters a and b. c Box plot showing the quantified amplitude values of the b wave between the two genotypes. d Box plot showing the quantified implicit response times after fERG stimulation. e Quantification of western blotting for unglycosylated (53 kDa) and glycosylated (85 kDa) OPN4 isoform protein levels in the two genotypes (+/+ n = 13, Afh/Afh n = 11). OPN4 levels were normalized to β-tubulin levels. f Opn4 expression levels in the SCN in Afh mutants (red) and controls (blue) (n = 25 +/+ , n = 24 Afh/Afh). g Relative expression of OPN4 normalized to multiple housekeeping genes at the two different time points, ZT0 and ZT12. The bars represent the average values for three different experiments ± SEMs (minimum n = 7 for each genotype at each time point). For each box plot (panels C and D), the small square indicates the mean, the central line illustrates the median, and the box limits indicate the 25th and 75th percentiles. The whiskers represent the 5th and 95th percentiles. * p < 0.05, ** p < 0.01, Student’s t test (c–f), two-way ANOVA plus Bonferroni post-test (g). All image analyses were performed with ImageJ software

