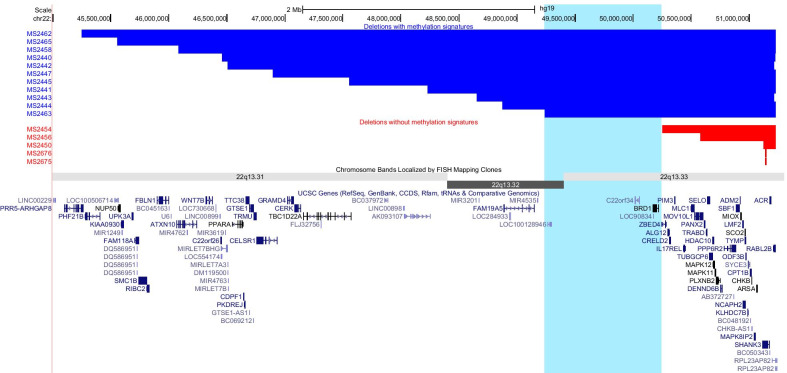
Fig. 4.
Phelan-McDermid syndrome deletions illustrating the genomic region of interest associated with methylation epi-signature. The horizontal blue bars represent deletions (2–6 Mb) associated with the presence of a distinct epi-signature. The horizontal red bars represent smaller deletions (0.01–1 Mb) that do not have a distinct methylation signature. Also shown in light blue is the common region of interest (22:49,238,268–50,248,907) in deletions associated with a methylation signature. All coordinates are taken from the EPIC Assay CNV analysis results. Cytogenetic bands and known genes are presented in this figure using the UCSC genome browser (Kent et al. 2002) 2009 (GRCh37/hg19) genome build

