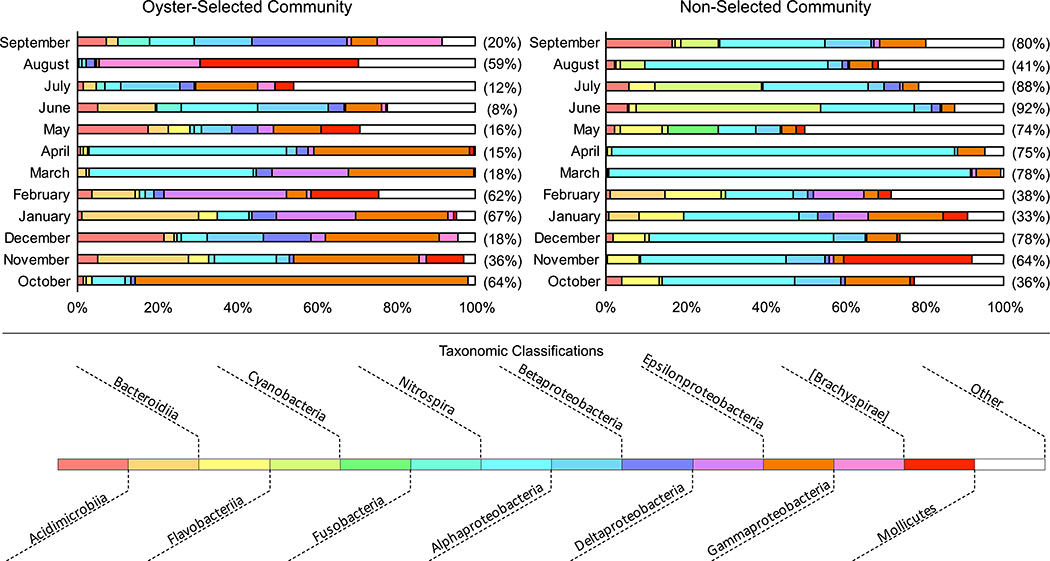
Fig. 3.
Relative abundances of bacterial oligotypes (class level) in oyster EF over time. Left: Relative abundances of autochthonous oligotypes (oligotypes significantly associated with oyster samples; n = 94). Right: Relative abundances of allochthonous oligotypes (oligotypes not significantly associated with oyster samples; n = 427). Abundances (bar length) are displayed as the proportion of the sub-community they comprise (i.e. the autochthonous community). The mean abundance of autochthonous oligotypes and allochthonous oligotypes in oyster EF communities each month is displayed in parentheses.

