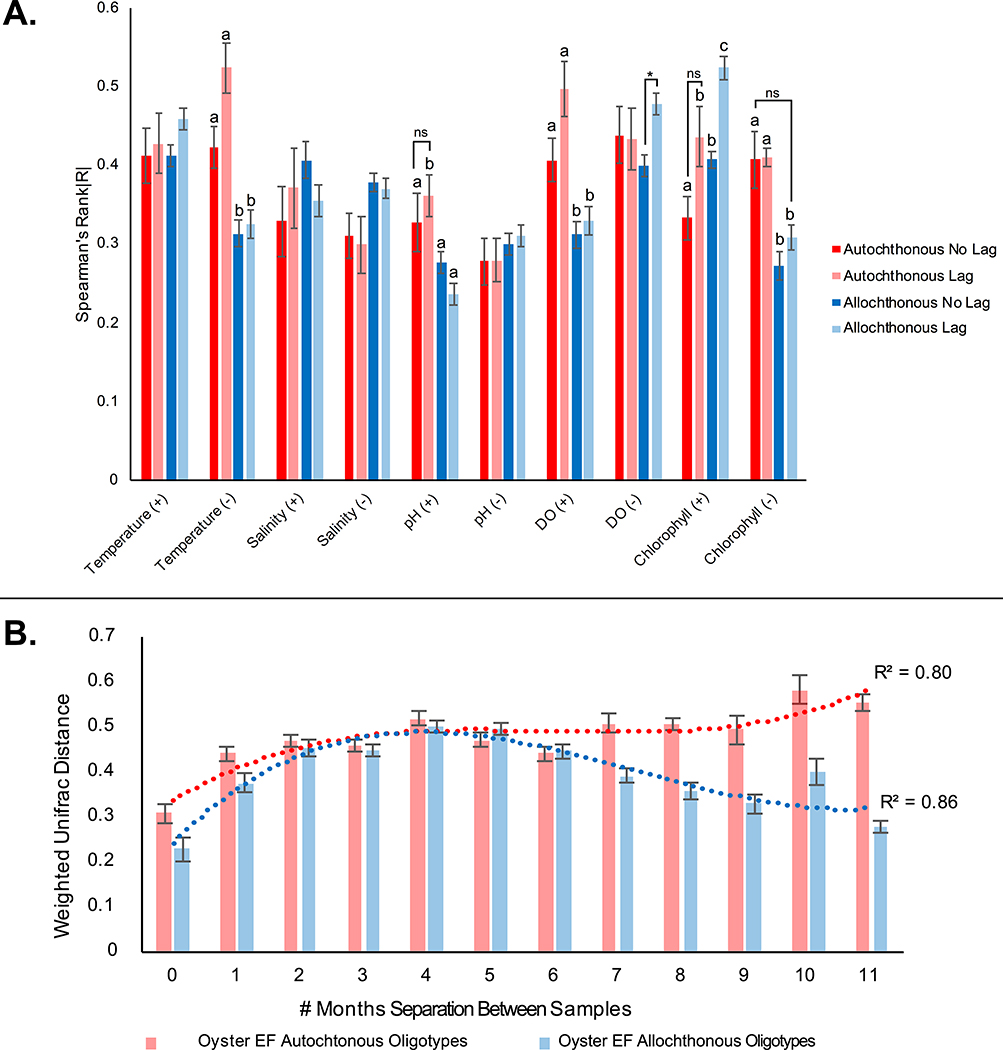
Fig. 5.
The impacts of time and environmental conditions on autochthonous and allochthonous communities. A) Strength of correlation of oligotype absolute abundance with measured environmental conditions. Oligotypes were split into positive R value and negative R value groups for each comparison as noted after each environmental condition. Oligotypes were also correlated with environmental conditions after introducing a one-month lag behind measured environmental parameters. Letters denote statistically significant groups (Kruskal Wallis, p < 0.05) except where noted (ns: not significant). Only one comparison was significantly different for the DO (−) strength of correlations (noted by *). B) Similarity of autochthonous and allochthonous communities in oyster EF over time. Community similarities were calculated by weighted Unifrac distance and grouped by the amount of time that passed between samples (e.g. January vs. March and July vs. September communities both belong to the 2 months between samples comparison). Red: Oyster EF autochthonous oligotypes; Blue: Oyster EF allochthonous oligotypes. Error bars are standard error.

