
FIG. 3.
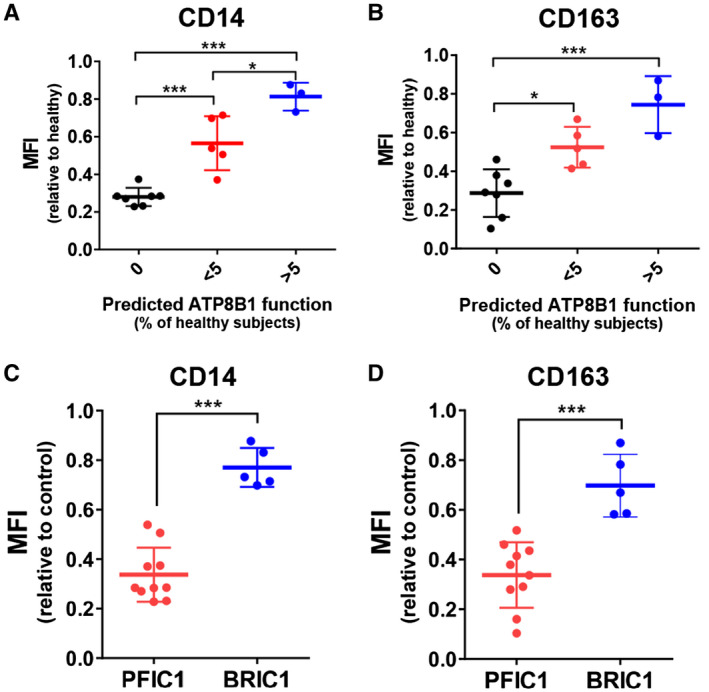
Expression of the M2c markers CD14 and CD163 in IL‐10‐treated HMDMs from patients with PFIC1 and BRIC1. IL‐10‐treated HMDMs were prepared from patients with PFIC1 and BRIC1, stained with fluorochrome‐labeled antibodies against CD14 and CD163, and analyzed by flow cytometry. Fourteen independent experiments were performed to analyze 10 patients with PFIC1 and 5 patients with BRIC1. In each experiment, control cells were pooled from more than three age‐matched control subjects to minimize interindividual variability. (A‐D) MFI of (A,C) CD14 (B,D) CD163 in each patient is expressed relative to that of control subjects analyzed simultaneously and shown based on the predicted ATP8B1 function in Fig. 2B (A,C) and clinical severity (B,D). Each bar represents mean ± SD. *P < 0.05, **P < 0.01, ***P < 0.001.