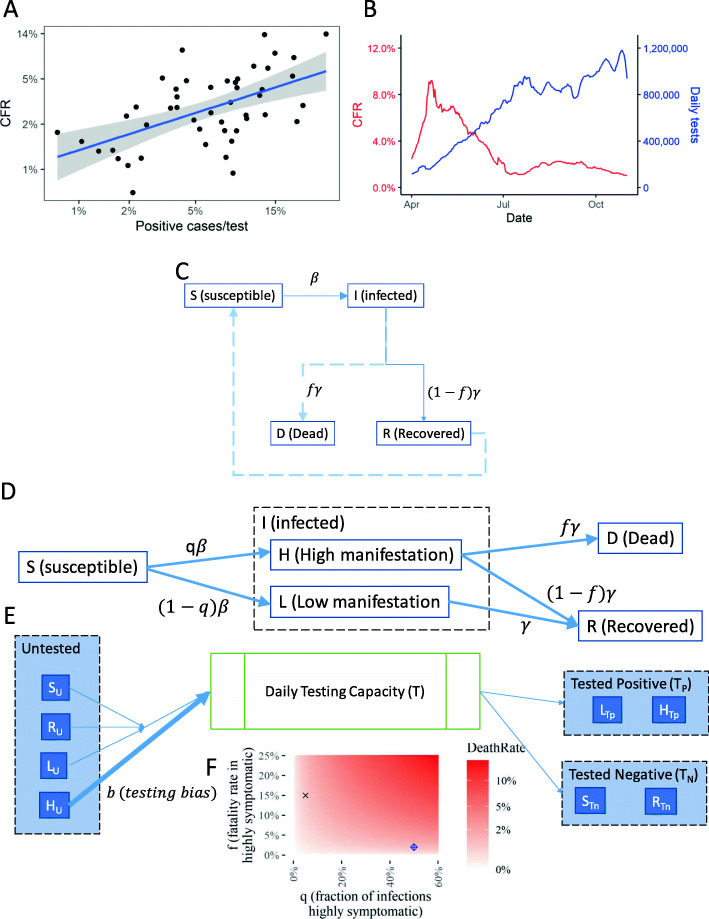
Fig. 1.
An Augmented Compartment Model to Predict Epidemic Dynamics with Testing Bias. a Regression of Case fatality rate, CFR (calculated as percentage of death in positively identified cases per country) against the percentage of positive cases identified among all tested per country show a linear regression; Each dot corresponds to a different country; Data obtained from ourworldindata.com for April 18, 2020 (SI 1); Blue line shows the fitted regression curve; Shaded area show the 95% confidence interval; R2 = 0.3567, p-value = 5.9e-6. b Longitudinal data of the calculated CFR vs. the total number of individuals tested daily in the US, with the tests performed, deaths reported, and new cases confirmed smoothed using the 7-day averages. c The basic SIRD compartmental model commonly used to model epidemic dynamics. Ordinary differential equations describe the movement of the population through the different compartments representing the susceptible, infected, recovered, and dead stages. The parameters are the rate constants for each term representing the transitions in the differential eq. d The augmented SIRD model by stratification of the infected population into H and L referring to high, and low manifestation of disease symptoms respectively; The factor q is the fraction of infected within H; We assume that high manifestation of disease leads to death in a fraction f of the individuals. e A simplified representation of the model of the testing policy; T tests are available per unit time; Untested alive individuals (U) are randomly selected in proportion to their numbers, but patients in H are selected with an increased bias b. Further compartments arising due to testing and movement at different stages are omitted here for clarity; Detailed equations in the Methods section. (e) Fraction f and q determine the true death rate; Two values with similar death rates chosen for simulations are marked

