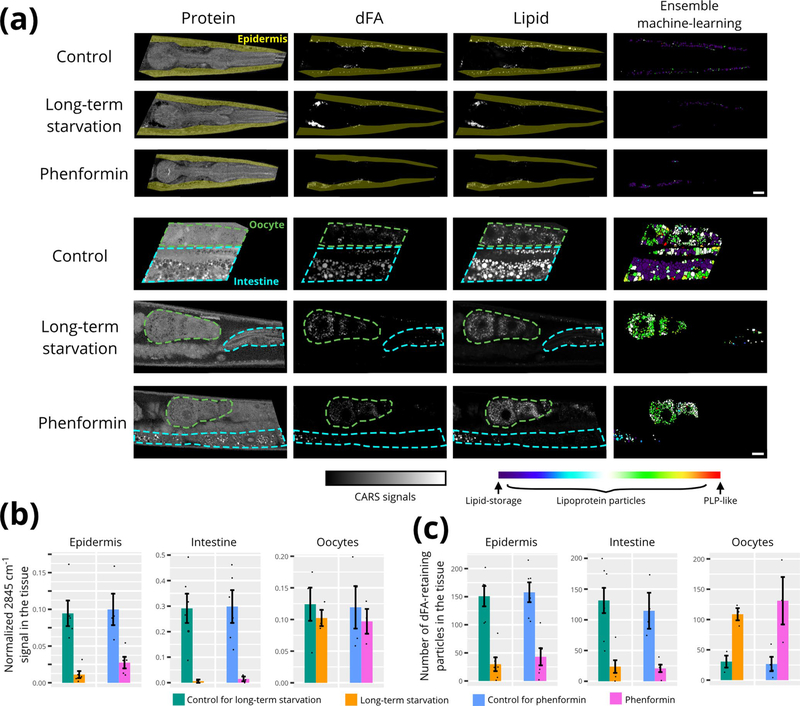
Extended Data Fig. 2 |. The effect of long-term starvation and phenformin.
a, The CARS images of control, long-term starved (18–20 hr), and phenformin-treated worms. The young adult worms that had been fed dFA since the late L4 stage (12 h) were placed on the OP50 lawns that lacked the deuterium label (for control), on the plates lacked OP50 (for 18–20 h long-term starvation), and on the OP50 lawns that lacked the deuterium label but contained phenformin (20 h treatment with final concentration = 7.5 mM), respectively. After that, the worms were imaged by BCARS. The right column is the results after applied the ensemble machine-learning method. Scale bar =10μm. The experiments were repeated at least three times independently with similar results. The region of pharyngeal neurons was excluded for the analysis of skin-like epidermis near pharynx. b, The normalized lipid content (or normalized mean 2845 cm−1 intensity) of total lipid-rich particles in the tissue (normalized to a fixed tissue area). c, The average number of the dFA-retaining observed in the tissue (normalized to a fixed tissue area). Total ~4000 particles were analyzed; the data were collected from n=3–6 biologically independent animals for each condition, where each measurement is presented as a dot; The error bars represent the standard error of the mean.

