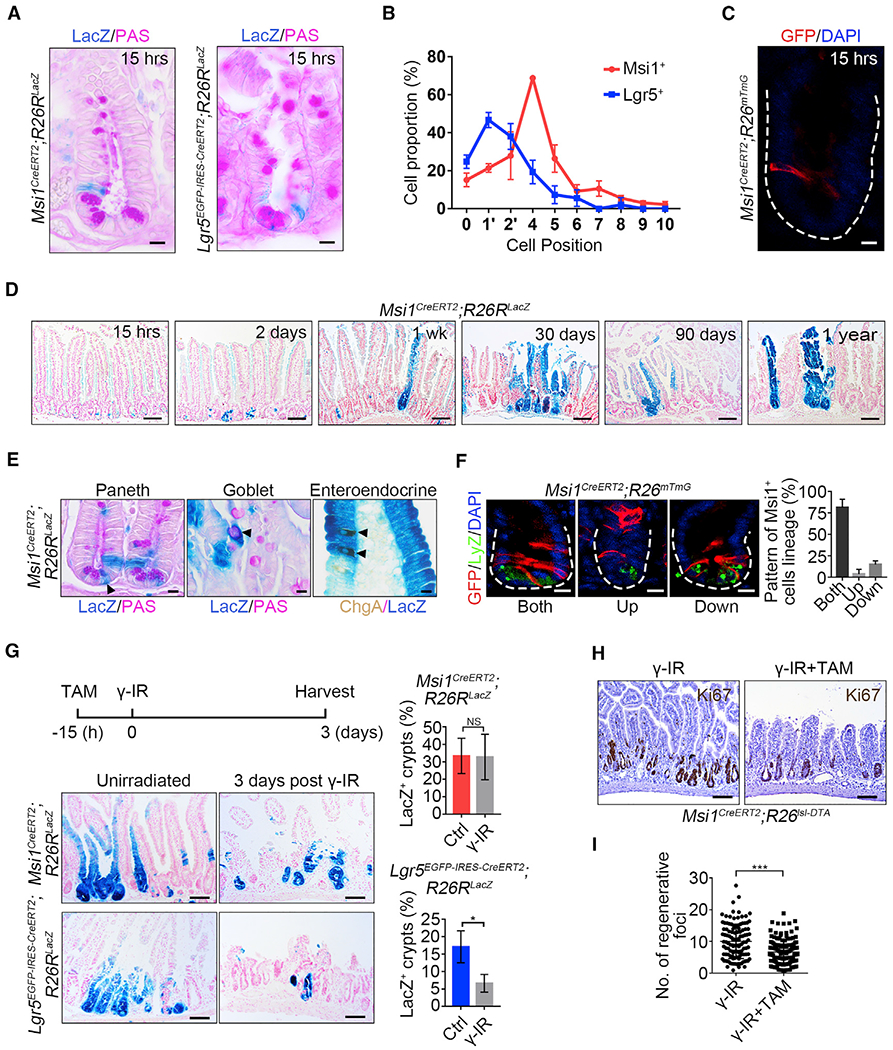
Figure 1. Msi1 Reporter-Marked Cells Are Enriched at +4 Position in Intestinal Crypts.

(A) Representative images of LacZ+ cells in Msi1CreERT2;R26RLacZ (302 crypts; n = 3 mice) and Lgr5EGFp-IRES-CreERT2;R26RLacZ (175 crypts; n = 3 mice) lineage-labeled small intestinal crypts 15 h after TAM induction. Scale bar, 10 μm.
(B) Quantification of the position of LacZ+ cells in intestinal crypts in (A). Data represent the mean value ± SD.
(C) Representative images of GFP+ cells in Msi1CreERT2;R26mTmG lineage-labeled small intestinal crypts 15 h after TAM induction. n = 3 mice. Scale bar, 10 μm.
(D) Low-magnification images of the LacZ+ ribbon in Msi1CreERT2;R26RLacZ lineage-labeled small intestine at different time points following TAM induction. n ≥ 3 mice at each time point. Scale bar, 40 μm.
(E) Periodic acid-Schiff (PAS) staining and immunohistochemistry for ChgA in Msi1CreERT2;R26RLacZ lineage-labeled small intestine 1 week after TAM induction. n = 3 mice. Scale bar, 10 μm.
(F) Double immunofluorescence for GFP and lysozyme in Msi1CreERT2;R26mTmG lineage-labeled small intestinal crypts one day after TAM induction. The position of GFP+ cells is above the +4 position, referred to as “Up”; below the +4 position, referred to as “Down”; above and below the +4 position, referred to as “Both.” Quantification of the lineage pattern of Msi1-reporter+ cells (n = 91 crypts; n = 3 mice). Data represent the mean value ± SD. Scale bar, 10 μm.
(G) Representative images of LacZ+ ribbons in Msi1CreERT2;R26RLacZ (Ctrl-720 crypts, n = 3 mice; γ-IR-540 crypts, n = 4 mice) and Lgr5EGFP-IRES-CreERT2;R26RLacZ (Ctrl-808 crypts, n = 3 mice; γ-IR-852 crypts, n = 4 mice) lineage-labeled small intestines 4 days after TAM induction, or the mice were irradiated after 15h of TAM exposure, and harvested 3 days after 12 Gy γ-IR. Scale bar, 10 μm. Quantification of LacZ+ ribbons under the indicated conditions. Data represent the mean value ± SD. NS, not significant; *p < 0.05 (Student’s t test).
(H) Msi1CreERT2;R26Isl-DTA mice irradiated 15 h after TAM induction and then harvested 3 days after γ-IR. Immunohistochemistry for Ki67 under the indicated conditions. Scale bar, 100 μm.
(I) Quantification of regenerative foci in (H) (Ctrl, n = 117 crypts, n = 3 mice; DTA, n = 139 crypts, n = 3 mice). Data represent the mean value ± SD. ***p < 0.001 (Student’s t test).
See also Figures S1 and S2.
