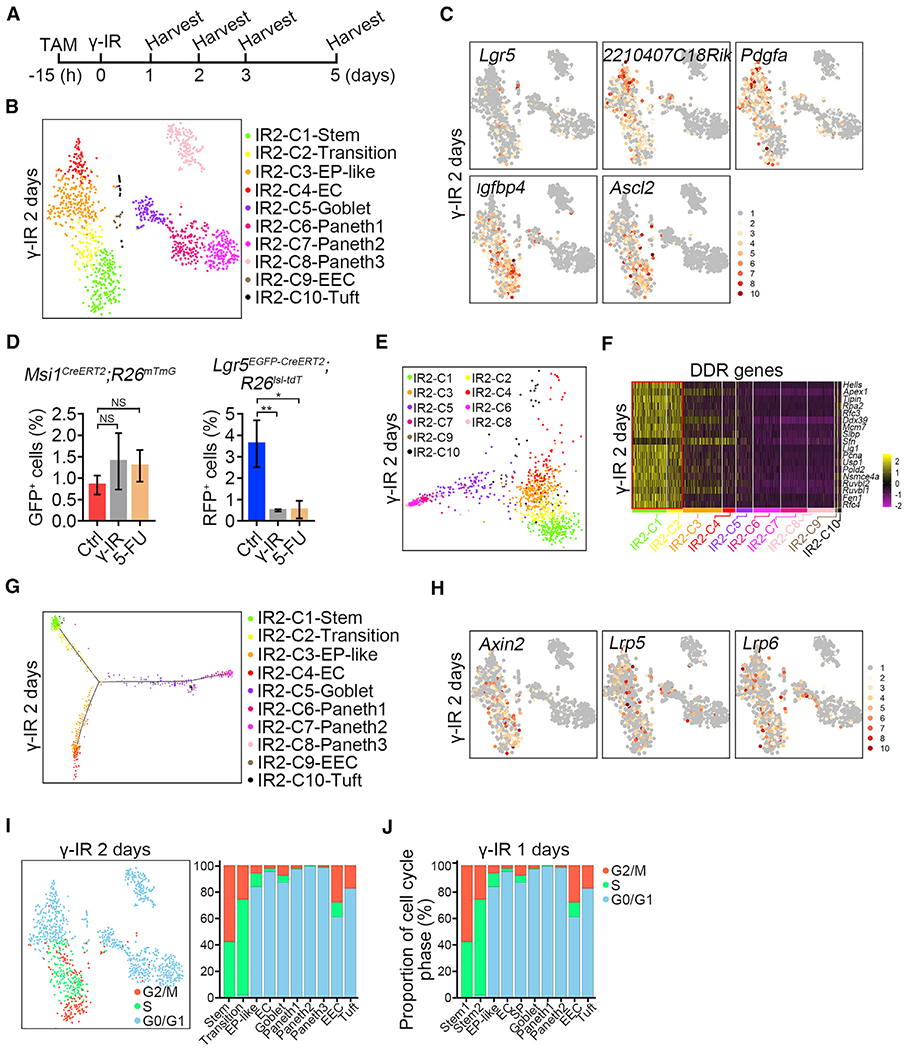
Figure 3. Cycling ISCs Initiate Intestinal Epithelial Regeneration.

(A) Strategy of sample collection for scRNA-seq after γ-IR.
(B) A t-SNE plot revealed cellular heterogeneity of 1,335 Msi1+ cell progeny from Msi1CreERT2;R26mTmG mice 2 days after γ-IR. The mice were pretreated with TAM 15 h before γ-IR.
(C) Feature plots of expression distribution for ISC marker genes 2 days after γ-IR.
(D) Quantification of Msi1+ (n = 3 mice) and Lgr5+ (n = 3 mice) populations 2 days after treatment with γ-IR or 5-FU. Mice were treated with γ-IR or two consecutive doses of 5-FU and then induced by TAM 15 h before sacrifice, as shown in Figure S4F. Data represent the mean value ± SD. NS, not significant; **p < 0.01 (Student’s t test).
(E) PCA showing the association of distinct cell clusters 2 days after γ-IR.
(F) Heatmap of DDR genes in distinct clusters 2 days after γ-IR.
(G) Pseudotime ordering of Msi1+ cell progeny 2 days after γ-IR.
(H) Feature plots of expression distribution for WNT pathway-related genes 2 days after γ-IR.
(I) Cell-cycle metrics of Msi1+ cell progeny 2 days after γ-IR.
(J) Proportions of cell-cycle stages in each cluster 1 day after γ-IR.
