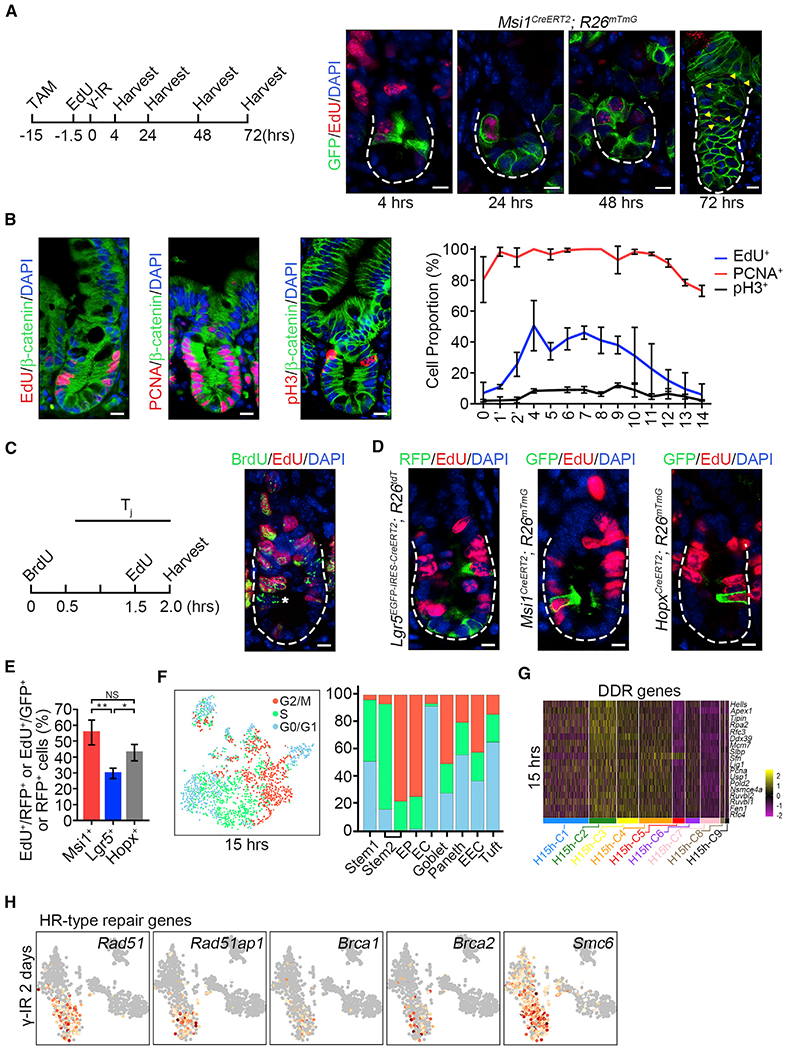
Figure 4. Msi1+ Cells Are More Rapidly Cycling Compared to CBCs.

(A) Strategy of testing whether EdU-labeled S-phase Msi1+ cells survive from γ-IR exposure. Msi1CreERT2;R26mTmG mice were treated by TAM and labeled using a 90-min pulse of EdU at 0.017 mg/25 g bodyweight 13.5 h after TAM induction and then irradiated 15h after TAM induction. Immunofluorescence for EdU and GFP in intestinal crypts at the indicated time points. n = 3 mice at each time point. Scale bar, 10 μm.
(B) Immunofluorescence for EdU/β-catenin, PCNA/β-catenin, and phosphor-histone 3/β-catenin in the intestinal crypts of WT mice. Scale bar, 10 μm. Quantification of EdU+ (n = 100 crypts; n = 3 mice), PCNA+ (n = 59 crypts; n = 3 mice) and pH3+ (n = 202 crypts; n = 3 mice) cells at the indicated position of intestinal crypts. Data represent the mean value ± SD.
(C) Schematics of the EdU and BrdU temporary space pulse method to calculate the average length of cell-cycle times (left). Cells still in S phase during the labeled time were EdU+BrdU+, whereas cells that exited S phase were EdU−BrdU+, indicated by asterisks (right).
(D) Immunofluorescence for RFP and EdU in intestines from Lgr5EGFP-CreERT2;R26Isl-tdT mice 15 h after TAM induction, and immunofluorescence for GFP and EdU in intestines from Msi1CreERT2;R26mTmG and HopxCreERT2;R26mTmG mice 15 h after TAM induction. Scale bar, 10 μm.
(E) Quantification of RFP+/EdU+ cells in intestinal crypts (n = 268 cells; n = 3 mice) and GFP+/EdU+ cells in Msi1CreERT2;R26mTmG (n = 162 cells; n = 3 mice) and HopxCreERT2;R26mTmG (n = 200 cells; n = 3 mice) intestinal crypts in (D). Data represent the mean value ± SD. NS, not significant; *p < 0.05; **p < 0.01 (Student’s t test).
(F) Cell-cycle metrics of Msi1+ cells at homeostasis.
(G) Heatmap of DDR genes in distinct clusters of Msi1+ cells.
(F) Feature plots of expression distribution for the key genes functioning in HR-type DNA damage repair 2 days after γ-IR.
See also Figure S5.
