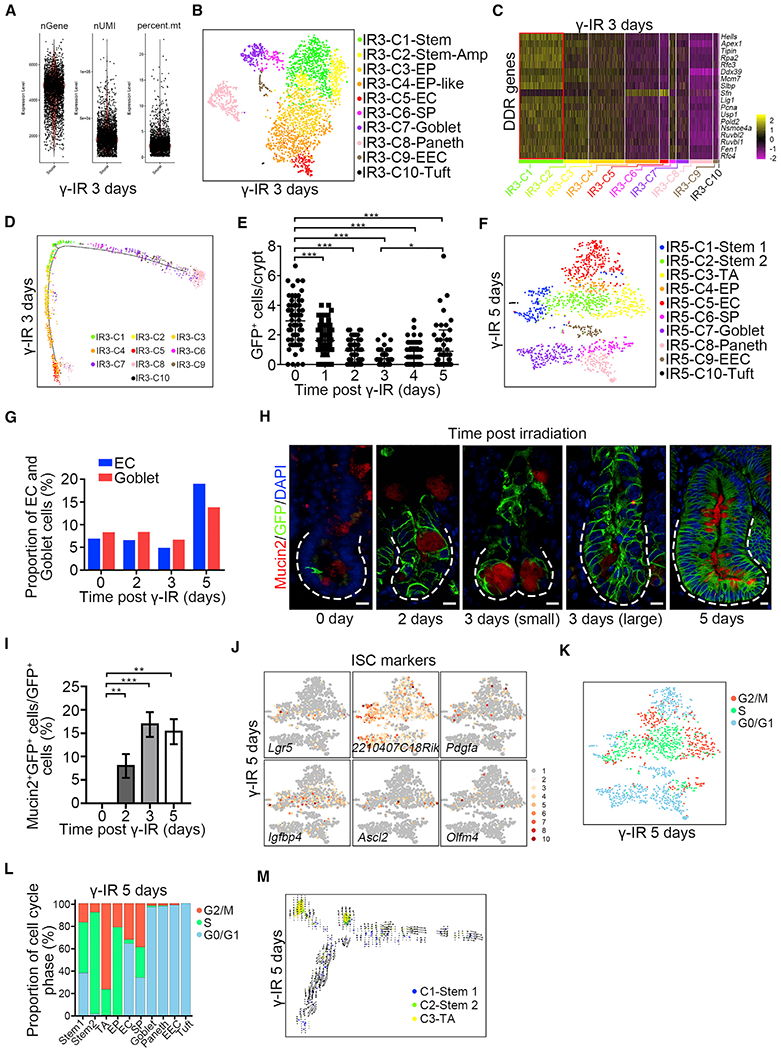
Figure 5. Msi1+ Cells Repopulate the Intestinal Epithelium at Early Stage When Lgr5high Cells Are Not Emerging.

(A) scRNA-seq data quality control of Msi1+ cell progeny from Msi1CreERT2;R26mTmG mice 3 days after γ-IR. The mice were pretreated with tamoxifen 15 h before γ-IR.
(B) A t-SNE plot revealed cellular heterogeneity of 3124 Msi1+ cell progeny from Msi1CreERT2;R26mTmG mice 3 days after γ-IR.
(C) Heatmap of DDR genes in distinct clusters 3 days after γ-IR.
(D) Pseudotime ordering on Msi1+ cell progeny 3 days after γ-IR.
(E) Quantification of GFP+ cells in the intestinal crypts of Lgr5EGFP-IRES-CreERT2 mice at the indicated time points after γ-IR. 180 intestinal crypts (60 crypts/mouse, n = 3 mice) were quantified at each time point. Representative images were shown in Figure S6H. Data represent the mean value ± SD. *p < 0.05; ***p < 0.001 (Student’s t test).
(F) A t-SNE plot revealed cellular heterogeneity of 1,556 Msi1+ cell progeny from Msi1CreERT2;R26mTmG mice 5 days after γ-IR.
(G) The proportion of EC and goblet populations of scRNA-seq results at the indicated time points after γ-IR.
(H) Immunofluorescence for Mucin2 and GFP in Msi1CreERT2;R26mTmG normal intestinal crypts and regenerative foci at the indicated time points after γ-IR. “small” indicates small regenerative foci; “large” indicates large regenerative foci. Scale bar, 10 μm.
(I) Quantification of the percentage of Mucin2+GFP+ cells versus GFP+ cells (n = 365 crypts, n = 3 mice per chase time point) in (H). Data represent the mean value ± SD. **p < 0.01, ***p < 0.001 (Student’s t test).
(J) Feature plots of expression distribution for ISC marker genes 5 days after γ-IR.
(K) Cell-cycle metrics on Msi1+ cell progeny 5 days after γ-IR.
(L) Proportions of cell-cycle stages in each cluster 5 days after γ-IR.
(M) RNA velocity analysis of IR5-C1 to IR5-C3 across the pseudotime trajectory 5 days after γ-IR.
