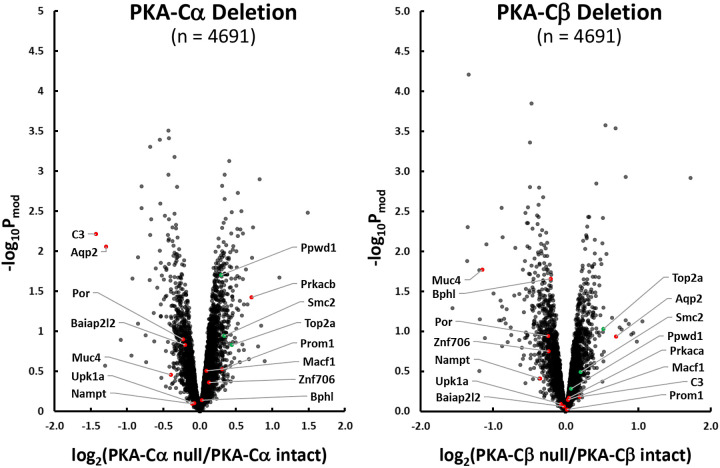
Fig. 2.
Effect of PKA-Cα (left) and PKA-Cβ (right) deletion on protein abundances in mouse mpkCCD cells. Red points indicate proteins decreased in PKA-Cα/PKA-Cβ double knockout cells (10). Green points indicate proteins increased in PKA-Cα/PKA-Cβ double knockout cells (10). Arrows to these red and green points show official gene symbols for the specific proteins. Pmod value, moderated P value.

