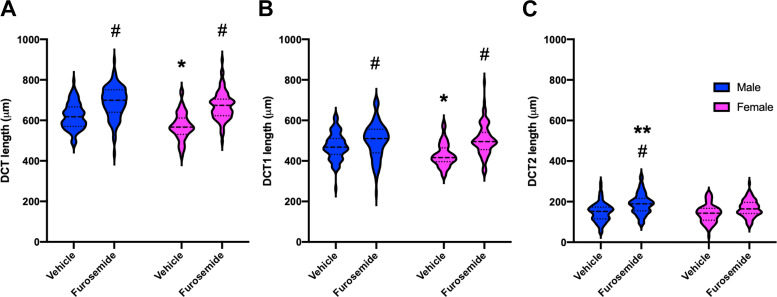
Fig. 6.
Remodeling of the distal convoluted tubule (DCT) length. A−C: violin plots showing the distribution of individual tubule length measurements and medians (dashed lines) and upper and lower quartiles (dotted lines) of the entire DCT length (A), early DCT (DCT1; B), and late DCT (DCT2; C) for vehicle- and furosemide-treated male mice (blue) and female mice (pink). Four kidneys per group and ∼25 DCTs per kidney were analyzed. Two-way ANOVA tests were performed, and P < 0.05 was considered statistically significant (*between sexes at the basal state, #effect of furosemide in the same sex, and **between sexes after furosemide, respectively).

