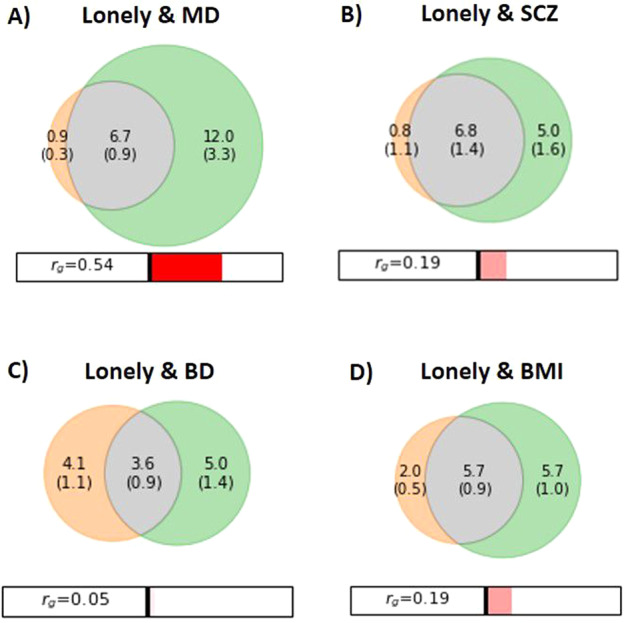
Fig. 1. Venn diagrams of unique and shared polygenic variants.

Venn diagrams showing polygenic overlap (gray) between A) loneliness (orange) and major depression (MD) (green), B) schizophrenia (SCZ) (green), C) bipolar disorder (BD) (green), and D) body mass index (BMI) (green). The numbers indicate the estimated quantity of causal variants (in thousands) per component, explaining 90% of SNP heritability in each phenotype, followed by the standard error. The size of the circles reflects the degree of polygenicity. Figures generated from MiXeR.
