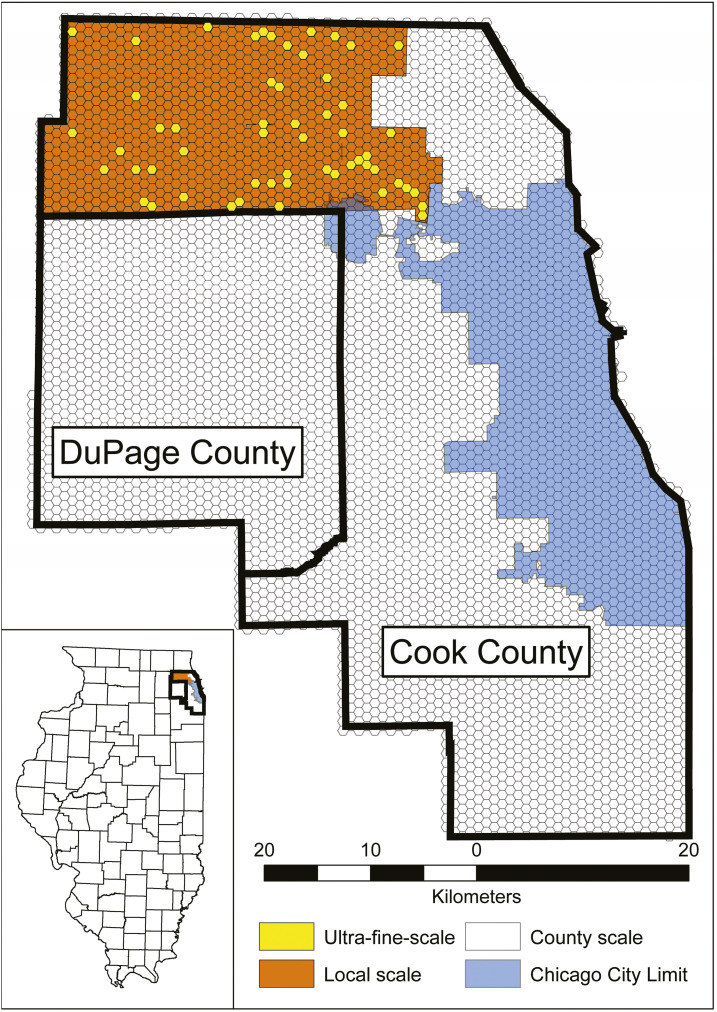
Figure 1.
West Nile virus model comparison study area, displaying the Chicago city limit and the 1-km hexagonal grid observational units within Cook and DuPage counties. The models for the county, local, and ultrafine-scales (UFS) comprise all hexagons contained within both Cook and DuPage counties (n = 5,345), the hexagons bounded by the Northwest Mosquito Abatement District (indicated by the orange and yellow hexagons, n = 1,019), and the hexagons indicated in yellow (n = 55), respectively. This figure appears in color at www.ajtmh.org.

