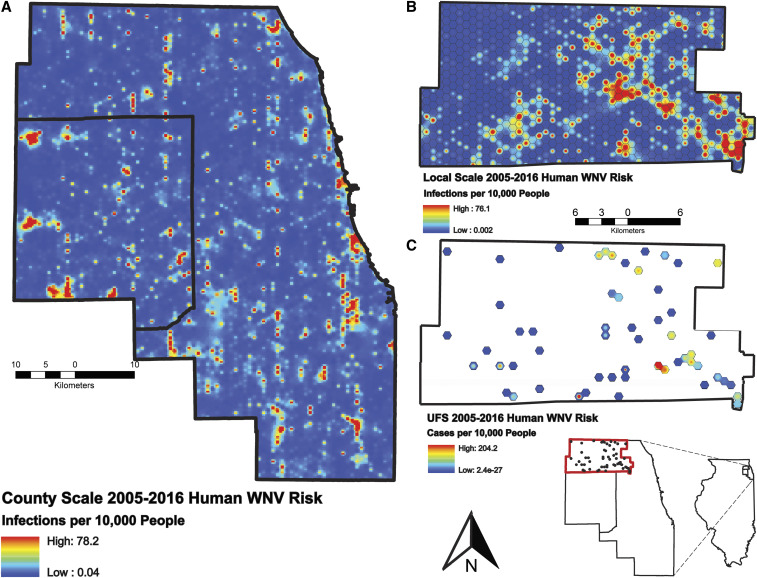
Figure 3.
High-resolution human West Nile virus (WNV) risk maps for county (A), local (B), and ultrafine (B) scales. Values correspond to total infections per 10,000 people from 2005 to 2016. Each pixel is populated by the best-fit models for each respective scale. This figure appears in color at www.ajtmh.org.

