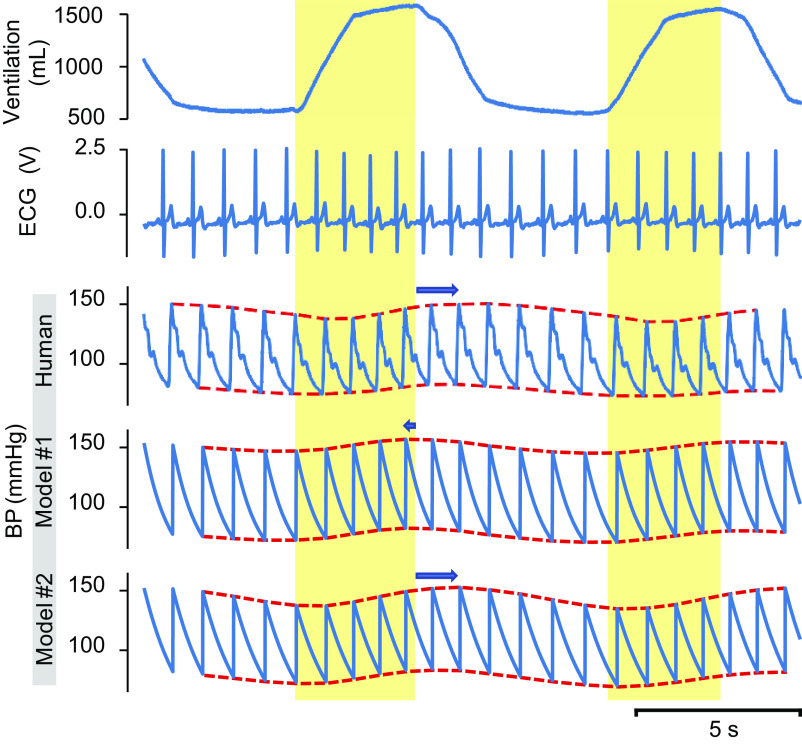
Fig. 1.
Physiological recordings from a volunteer participant during slow deep breathing. Recordings include tidal volume [VT, 1st (top) trace], electrocardiogram (ECG, 2nd trace), and arterial blood pressure (BP, 3rd trace). Simulations of blood pressure from Model 1 (4th trace) and Model 2 [5th (bottom) trace] use features of the participant’s cardiovascular data as an input. The yellow-shaded intervals correspond to inspiration. The red dotted lines superimpose on the human BP tracing, and model BP traces delineate the modulation of the end-systolic and end-diastolic BP. The blue arrows show a shift of the BP modulation envelope relative to the transition time from inspiration to expiration.

