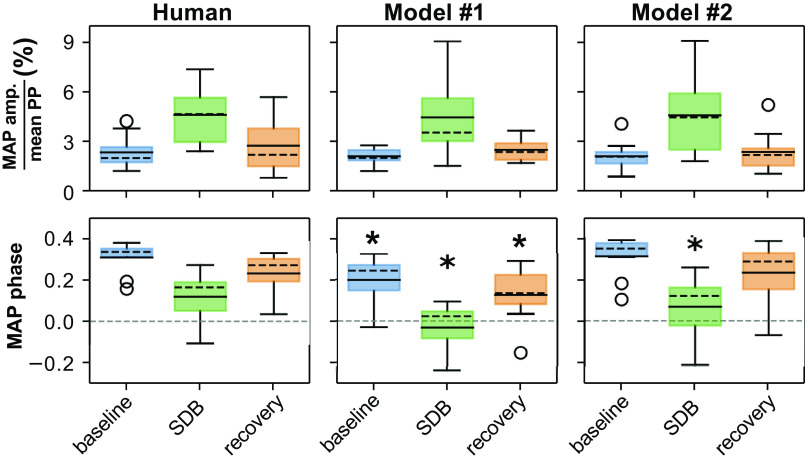
Fig. 5.
The amplitude of modulation of mean arterial pressure (MAP) as a percent of the pulse pressure (PP) (upper row) and the respiratory phase of MAP modulation (lower row) is used to evaluate model performance against human participant data. Data are depicted as box-and-whisker plots with both mean (solid black horizontal line) and median (dashed black horizontal line). *Significant difference compared with the corresponding epoch in the human data (P < 0.025).

