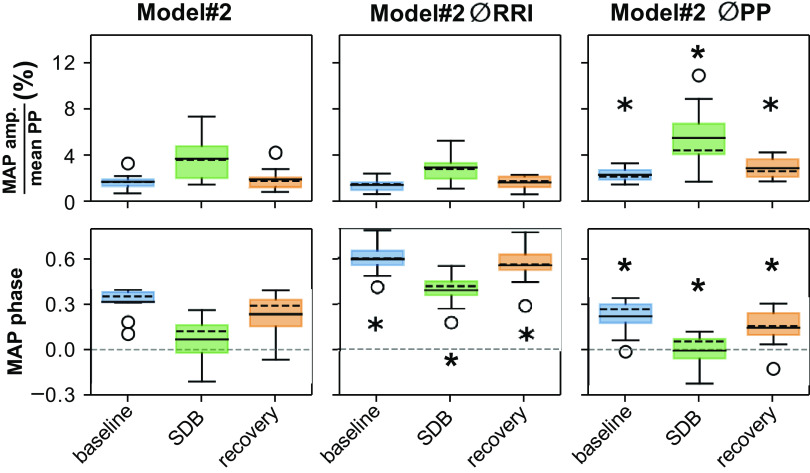
Fig. 6.
Modulation amplitude and modulation phase of MAP in Model #2 without respiratory modulation of the RR interval (Model #2 ØRRI) and without respiratory modulation of arterial pulse pressure (Model #2 ØPP). Data are depicted as box-and-whisker plots with both mean (solid black horizontal line) and median (dashed black horizontal line). *Significant difference compared with the corresponding epoch in the Model #2 (P < 0.025).

