
Figure 2.
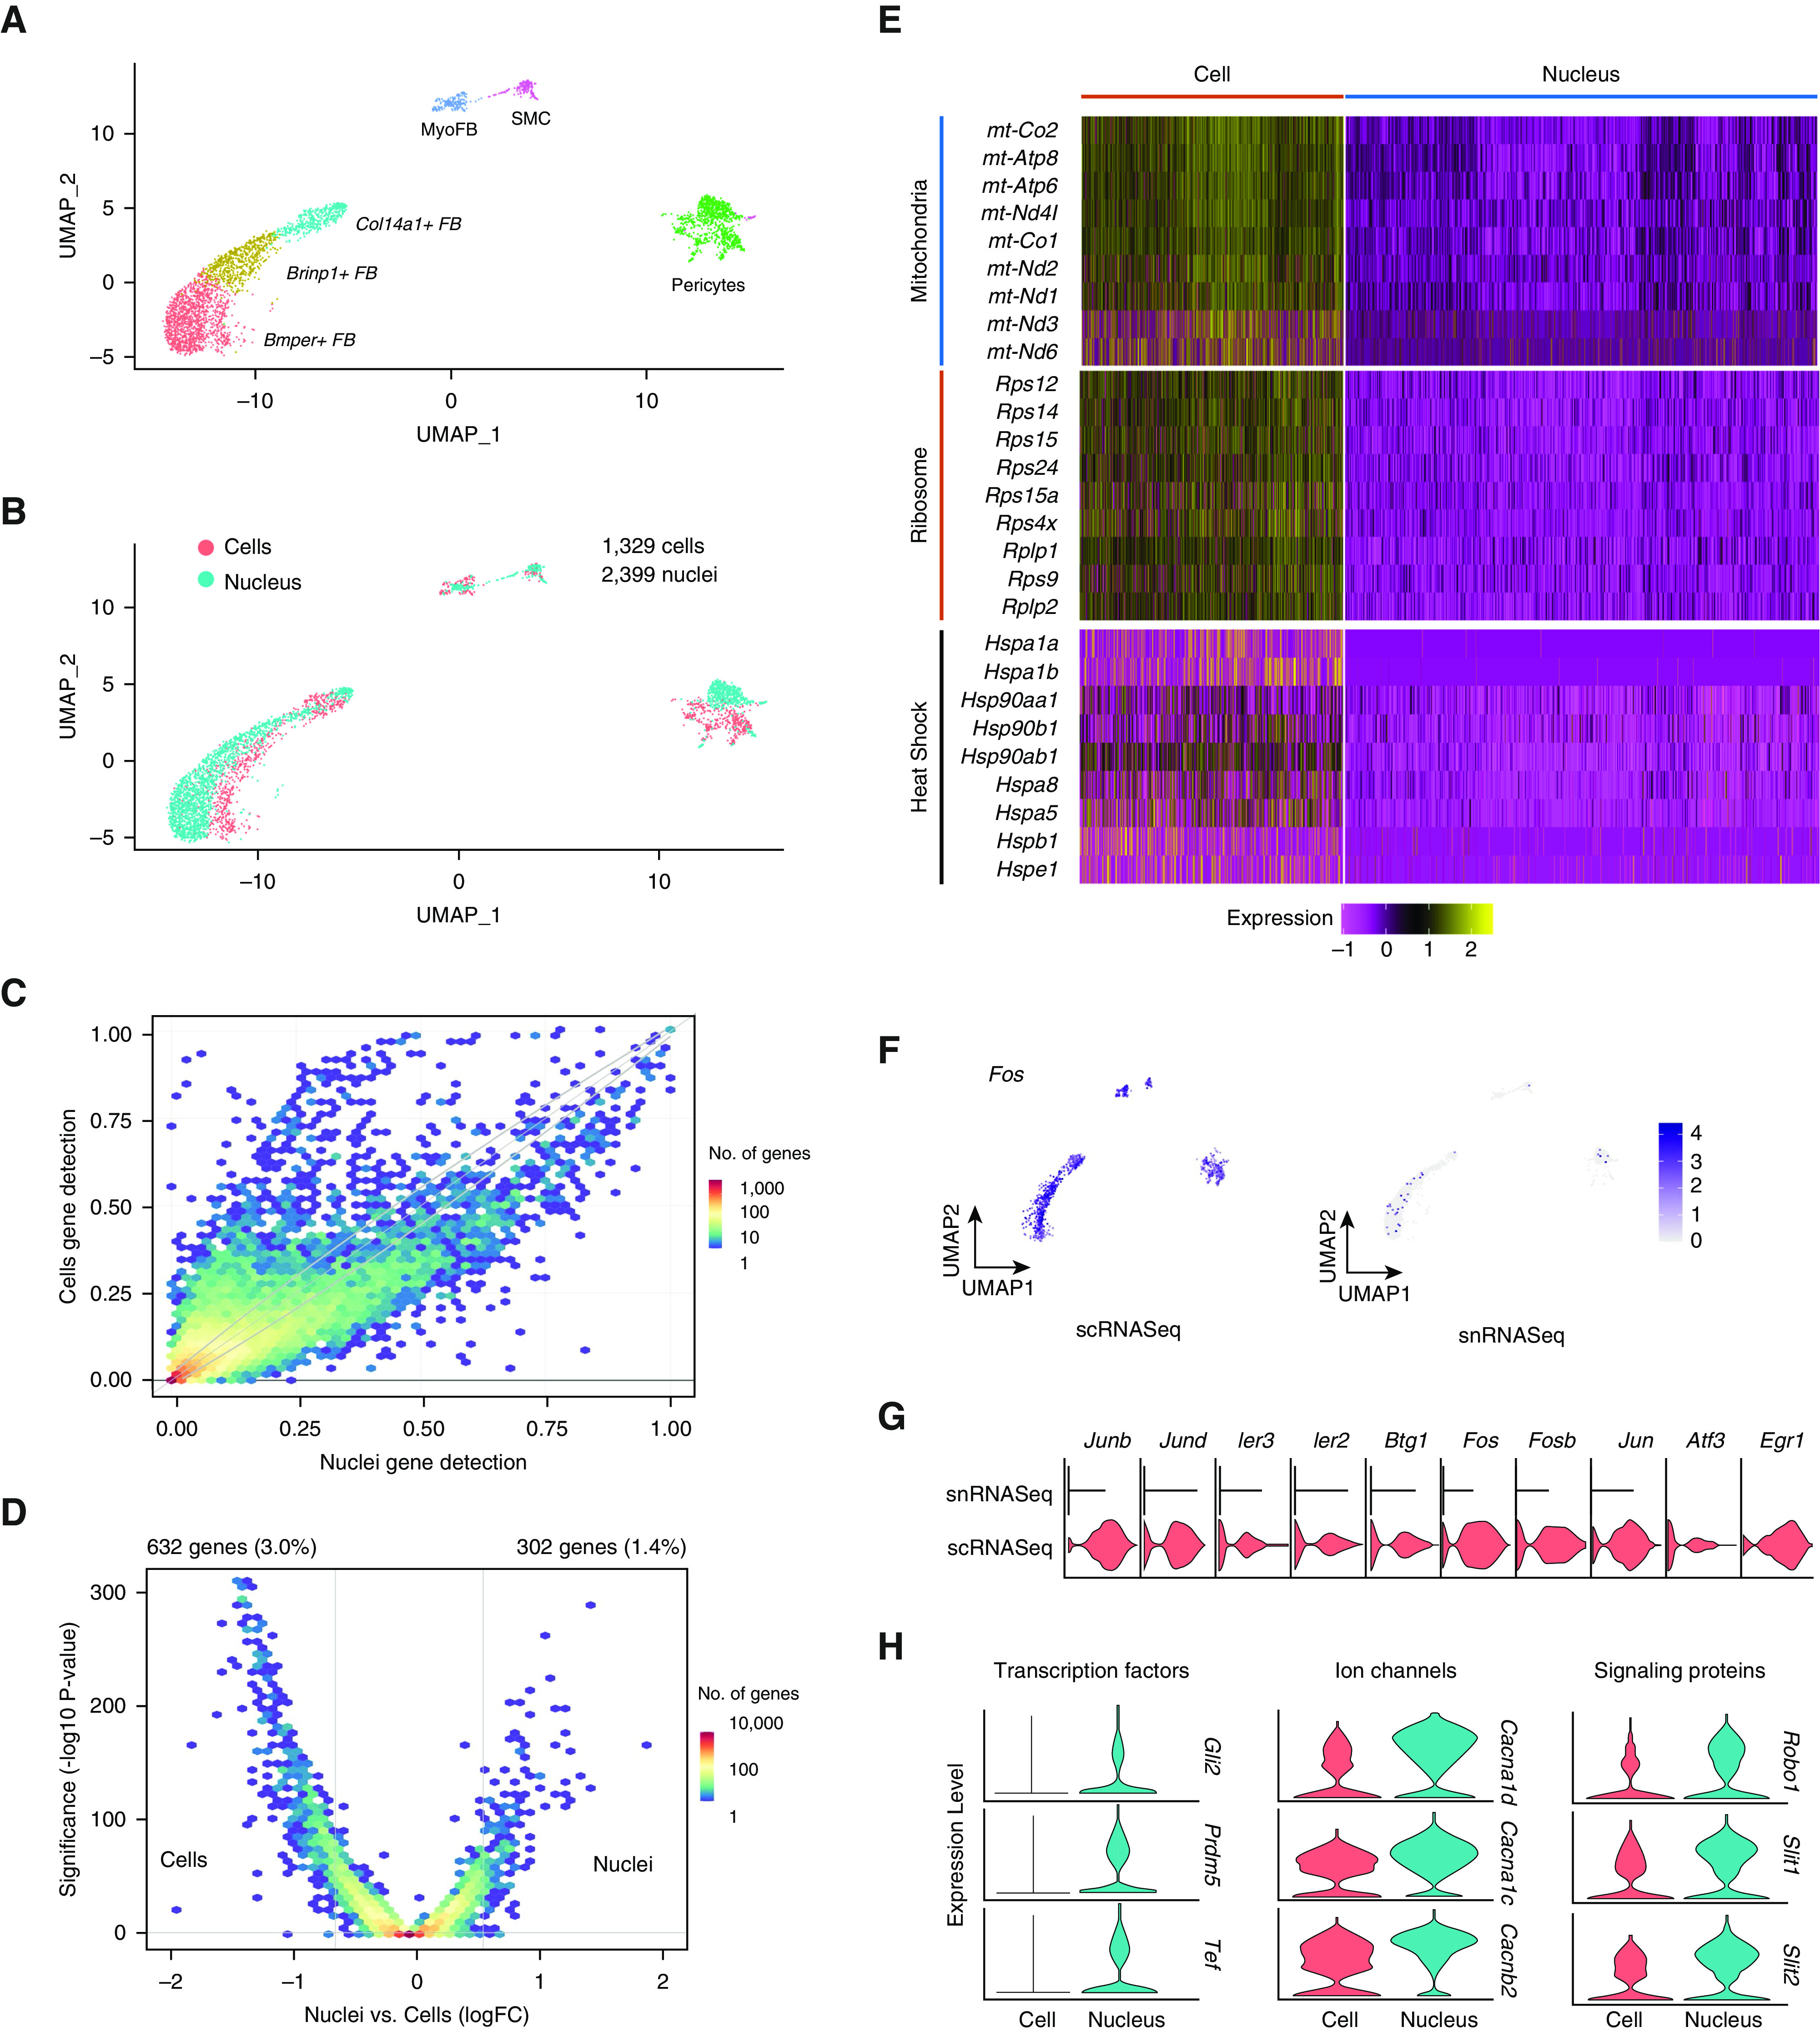
Merged single-cell and single-nucleus mesenchymal cells and differential expression between techniques. (A) Uniform manifold approximation and projection plot of cell types after isolating mesenchymal subsets. (B) Overlap of transcriptomes from cells and nuclei after subclustering. (C) Binned scatterplot illustrating genes detected more reliably in cells versus nuclei, with gray lines marking the 95% confidence interval of variation detected by chance. (D) Volcano plot showing that 3.0% of genes are more highly expressed in cells (log fold change > 0.5; adjusted P value < 0.05), whereas 1.4% of genes are more highly expressed in nuclei. (E) Increased single-cell RNA-sequencing expression of mitochondrial, ribosomal, and heat shock–response genes shown by heatmap. (F) Stress-response markers are distributed equally among cell types and are enriched in single-cell data (G). (H) Select genes with increased expression in single-nucleus RNA-sequencing data, including ion channels, signal transduction proteins, and transcription factors. Bmper = BMP binding endothelial regulator; Brinp1 = BMP/retinoic acid inducible neural specific 1; Cacna1d = Calcium voltage-gated channel subunit alpha 1d; Cacna1c = Calcium voltage-gated channel 1c; Cacnb2 = Calcium voltage-gated channel subunit beta 2; Fos = Fos proto-oncogene, AP-1 transcription factor subunit; Gli2 = Gli family zinc finger 2; Prdm5 = PR/SET domain 5; Robo1 = Roundabout guidance receptor 1; Slit1 = Slit guidance ligand 1; Slit2 = Slit guidance ligand 2.