
Figure 1.
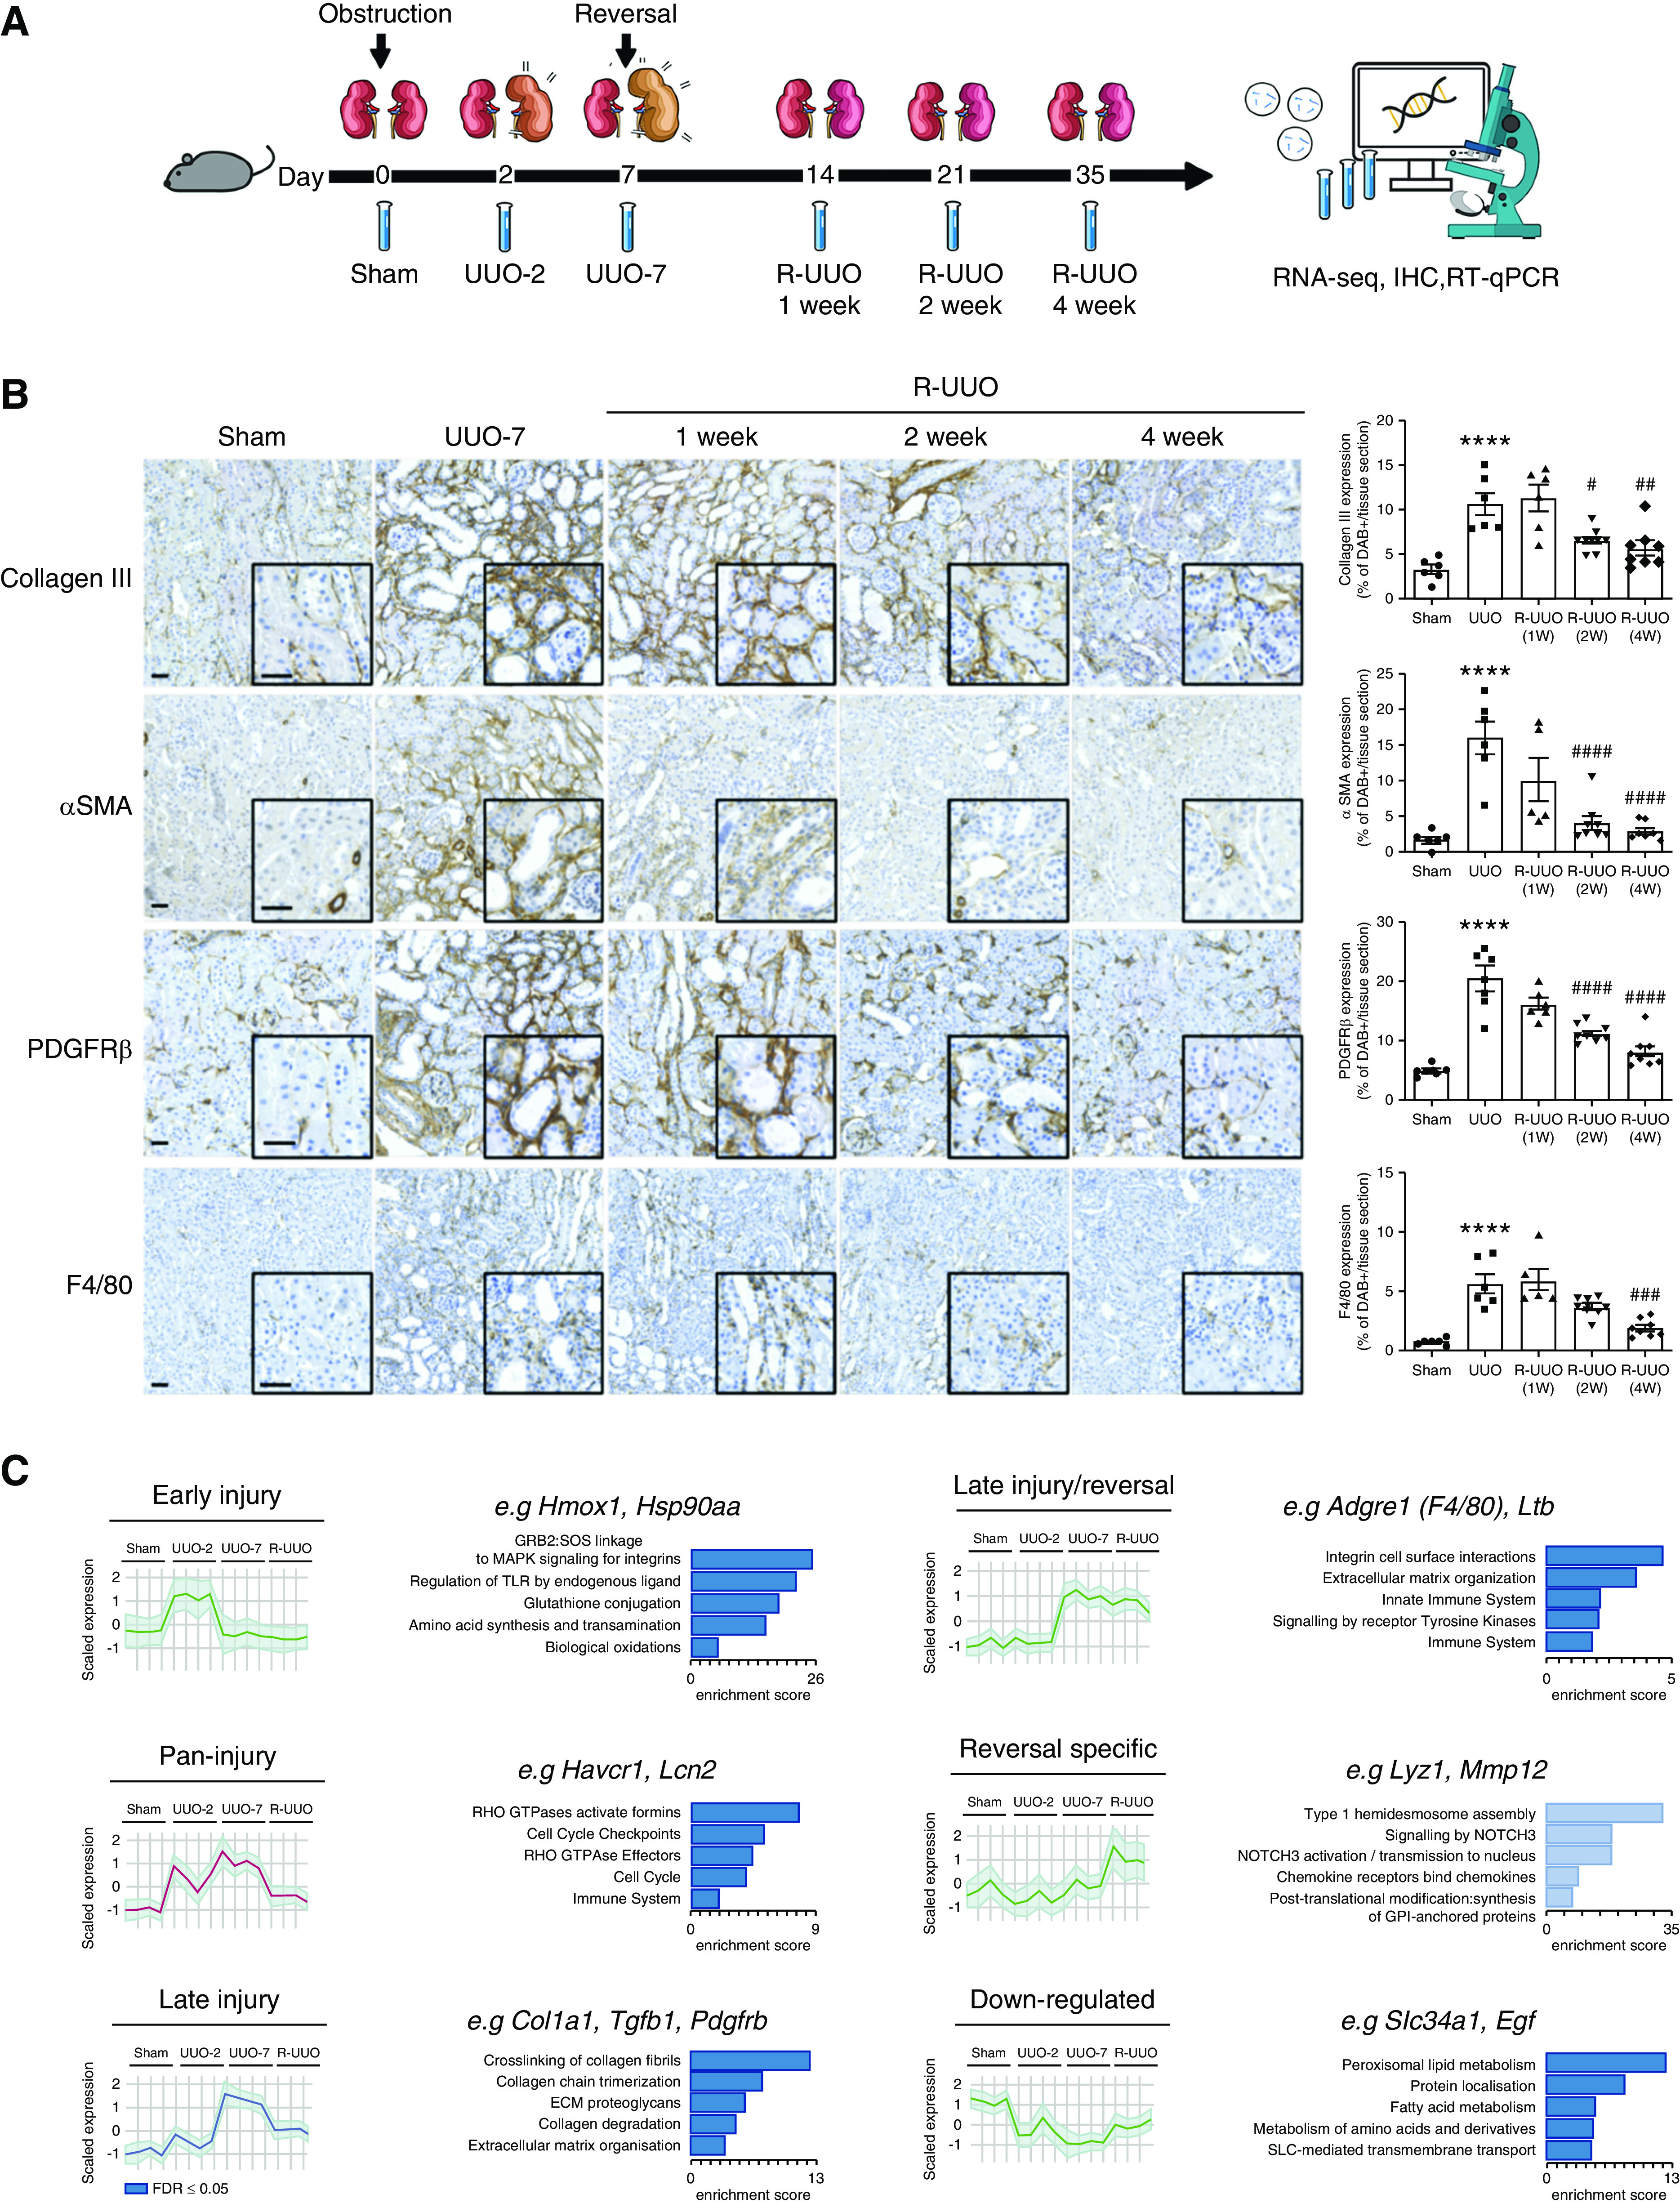
Phases of progression and regression of fibrosis in the R-UUO model are associated with dynamic changes in the renal transcriptome. (A) Male 6- to 8-week-old C57BL/6J mice underwent either UUO or sham surgery, and were either euthanized 2 days later, or left obstructed for 7 days and then euthanized, or had their ureter reimplanted to reverse obstruction before euthanasia at 1, 2, or 4 weeks post UUO (n=6–8 per group). (B) Representative images and quantification of fibrosis (collagen III) and fibroblast (PDGFR-β), myofibroblast (α-smooth muscle actin [α-SMA]), or macrophage (F4/80) accumulation during the R-UUO model. Scale bar, 50 µM. ****P<0.0001 versus sham, #P<0.05 versus UUO, ##P<0.01 versus UUO, ###P<0.001, ####P<0.0001 versus UUO. (C) Unbiased clustering analysis of bulk RNA sequencing data from the renal cortex of mice (n=4 per group) during the R-UUO time course identified six discrete temporal patterns of gene expression. Representative genes and enriched pathways are provided for each cluster. The number of genes included in each cluster is as follows: Down-regulated 1562; Early injury, 779; Pan-injury, 1479; Late injury, 1619; Late injury/reversal, 1708; and Reversal specific, 663. Shaded error range is the SD of the mean scaled gene expression for each animal. Dark and light blue pathways are those demonstrating gene enrichment at a false discovery rate of <0.05 and >0.05, respectively. FDR, false discovery rate; IHC, immunohistochemistry; RT-qPCR, quantitative RT-PCR.