Figure 2.
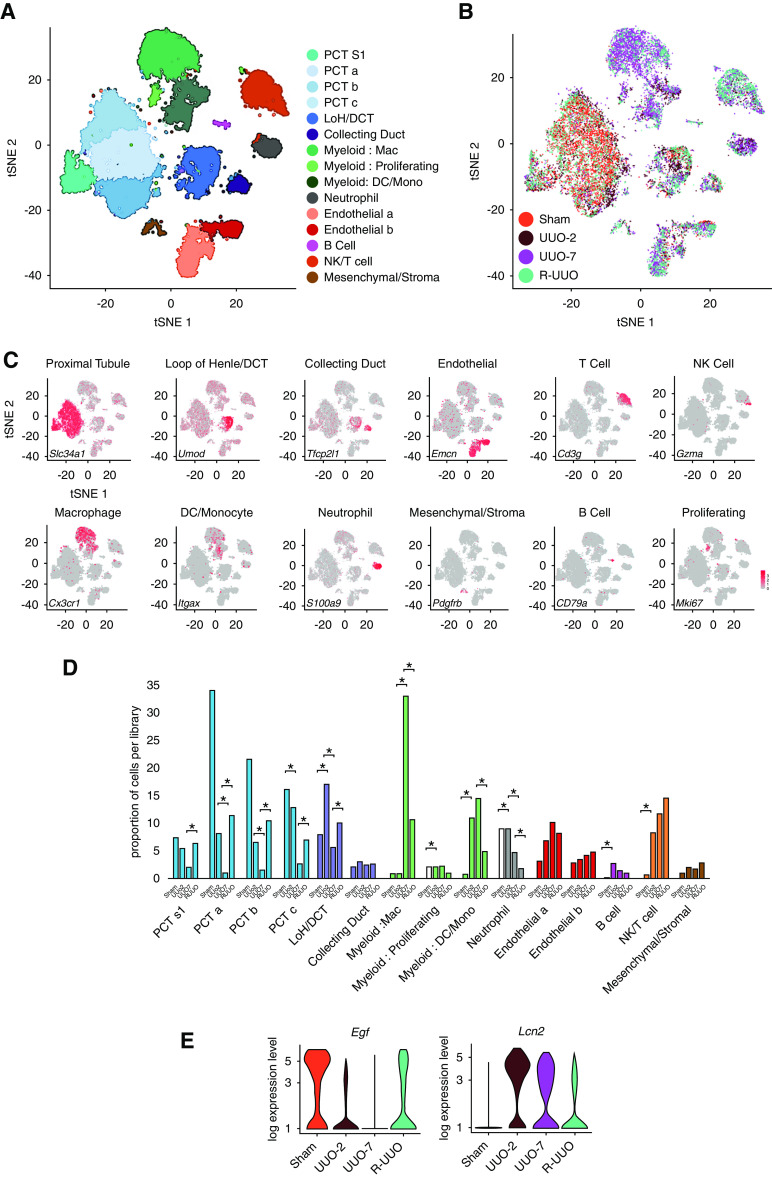
scRNA-seq analysis identifies discrete renal cell types, with dynamic changes in the proportion and transcriptome of each cell type observed across the R-UUO model. tSNE plots of 17,136 cells from libraries pooled from mice that underwent sham, UUO-2, UUO-7, or R-UUO (2 weeks) (n=3 per time point) classified by (A) cell cluster and (B) time point. (C) Expression of selected marker genes for each cell classification projected onto tSNE plot. Color scale is log10 expression levels of genes. (D) Relative proportions of cells assigned to each cluster by time point. Statistical significance derived using differential proportional analysis, with a mean error of 0.1 over 100,000 iterations. *P<0.05. (E) Violin plots of Egf and Lcn2 (encodes neutrophil gelatinase-associated lipocalin) gene expression in the loop of Henle/distal convoluted cell cluster. The y axis shows the log-scale normalized read count. a–c, PCT subclusters colored by shared nearest neighbor; DCT, distal convoluted tubule; LoH, loop of Henle; Mac, macrophage; Mono, monocyte; NK, natural killer cell; PCT, proximal convoluted tubule; S1, S1 segment.

