
Figure 6.
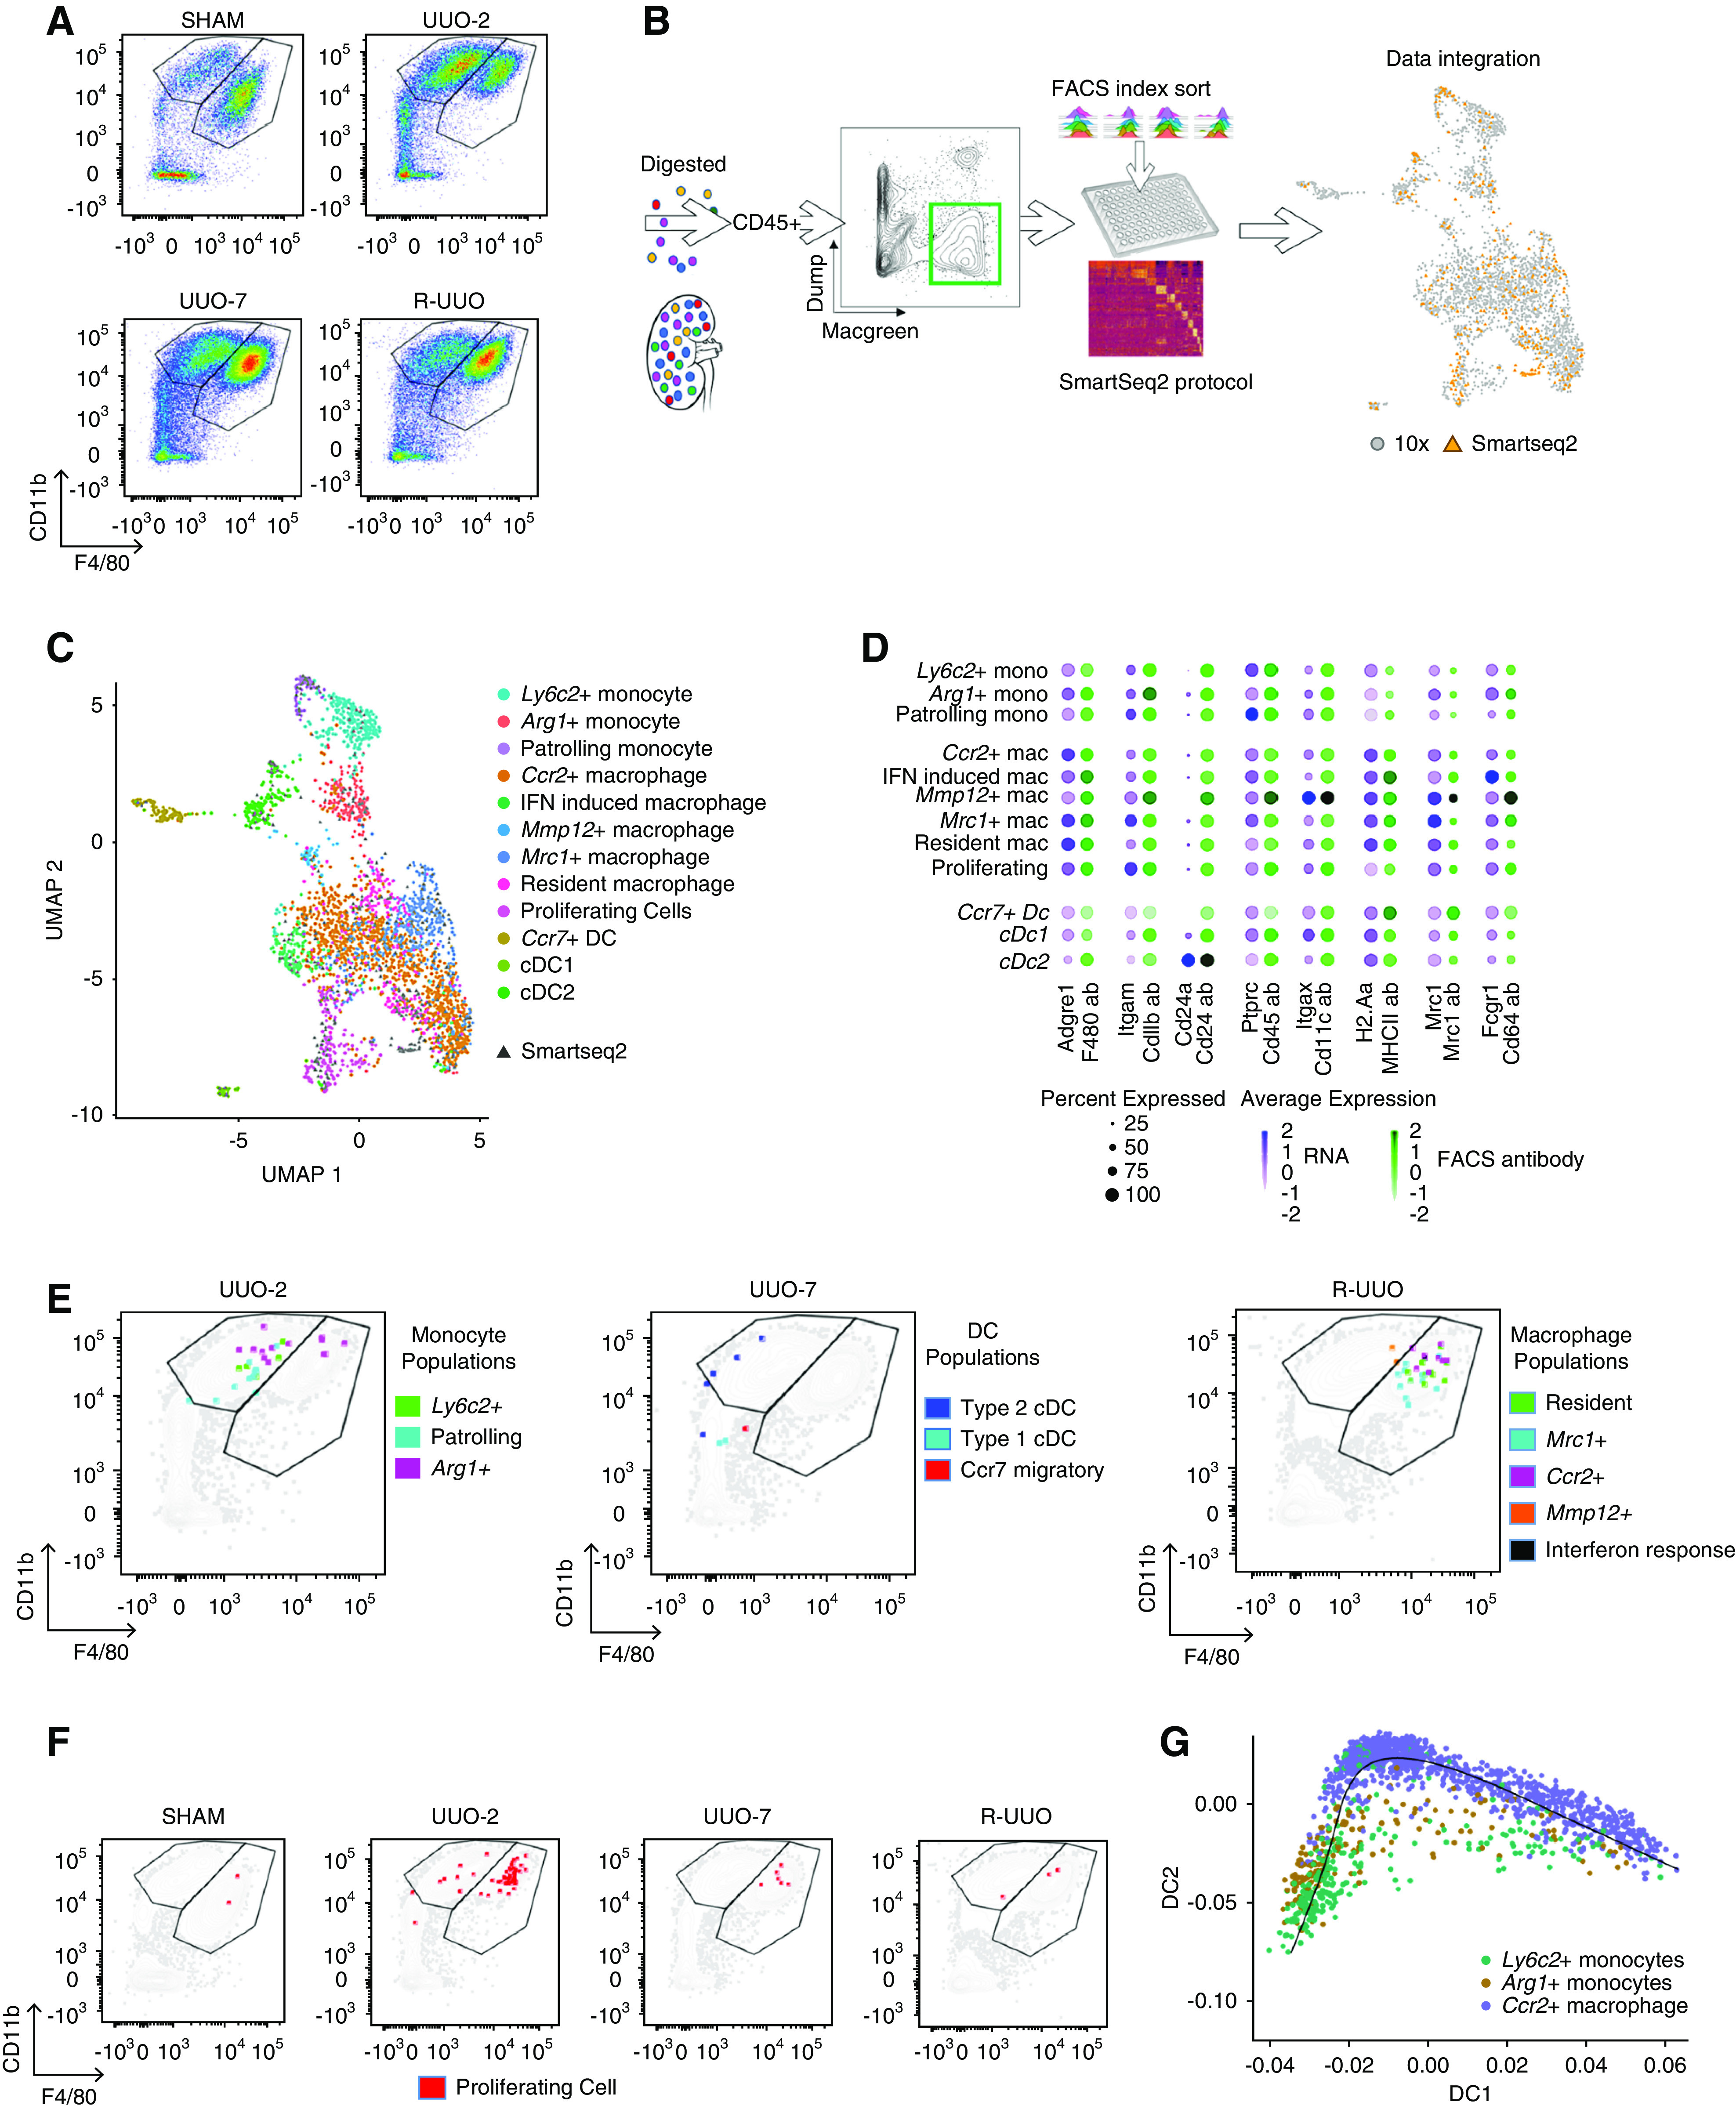
Integration of droplet– and plate-based scRNA-seq datasets determines that clusters identified by scRNA-seq would not be readily discriminated on conventional flow cytometry. (A) Representative flow cytometry plots from kidney cell suspensions from each time point after gating on CD45+MacGreen+TCRβ−CD19−Ly6G−Siglec-F− myeloid cells. Cells segregated into CD11b+F4/80Lo monocyte and CD11b+F4/80Hi macrophage gates. (B) Strategy to integrate gene and cell surface protein expression at the single-cell level. Kidneys were digested into single-cell suspensions and single CD45+MacGreen+TCR1β−CD19−Ly6G−Siglec-F− myeloid cells were sorted into individual wells after index linkage to cell surface marker expression. They underwent scRNA-seq using the SMART-seq2 protocol before integration with the 10× dataset. (C) Uniform Manifold Approximation and Projection (UMAP) of the combined 10× and SMART-seq2 dataset. (D) Dotplot of cell surface protein and corresponding gene expression in each cluster. The size of the dot denotes the percentage of cells in each cluster expressing the relevant gene/protein; the intensity of color represents mean gene/protein expression. (E) Representative flow cytometry plots from UUO-2, UUO-7, and R-UUO (2 weeks) illustrate mapping of cells from each myeloid cluster onto the CD11b+F4/80Lo monocyte and CD11b+F4/80Hi macrophage gates. (F) Mapping of proliferating cells (red) at each time point onto the flow cytometry plots. (G) Pseudotime analysis of the transcriptomes of the Ly6c2+, Arg1+, and Ccr2+ clusters. Mac, macrophage; mono, monocyte.